eurostat-map
eurostat-map documentation
Check out this observable notebook for a quickstart guide.
This document is the narrative usage guide. For generated, signature-accurate API docs from TypeScript/JSDoc, see the API docs.
Contents
- eurostat-map documentation
Map creation
Create a map with let map = eurostatmap.map( mapType ). Set the parameter mapType to a value corresponding with the desired map type:
"choropleth"for a choropleth map,"bivariateChoropleth"for a bivariate choropleth map."trivariateChoropleth"for a ternary choropleth map.- “proportionalSymbol” (or
ps) for a proportional symbol map, - “pie” (or
pieChart) for a proportional pie chart map, "categorical"for a categorical map.- “stripe” (or
stripeComposition) for a stripe composition map. "sparkline"for a spark line map."flow"for a flow map."coxcomb"for a coxcomb map."mushroom"for a mushroom map."waffle"for a waffle map.- “bar” for a bar chart map.
The map can then be customised with the methods listed in the tables below. Most of the map methods follow the pattern map.myMethod([value]): If a value is specified, the method sets the parameter value and returns the map object itself. If no value is specified, the method returns the current value of the parameter.
It is also possible to specify the map parameters as an object: let map = eurostatmap.map( mapType, { param1: v1, param2: v2} );. This is equivalent to: let map = eurostatmap.map( mapType ).param1(v1).param2(v2);
For multi-layer stacks, call eurostatmap.map() without a map type and define thematic layers with .layers([...]) (or .addLayer(...)). See Multi-layer guide.
Map definition
Specify the map SVG element.
| Method | Type | Default value | Description |
|---|---|---|---|
| map.svgId([value]) | String | “map” | The id of the SVG element of the HTML page where to draw the map. |
| map.containerId([value]) | String | same as svgId | Optional container element used for tooltip bounds and (when explicitly set) height constraints. |
| map.width([value]) | int | min(795, window.innerWidth) | The width of the map, in pixel. |
| map.height([value]) | int | auto | The height of the map, in pixel. If not specified, the height is set automatically as 85% of the width. |
| map.layers([value]) | Array | [] | Multi-layer stack declaration. Use only when map() is created without a map type. Each item is a layer config object (for example { type: 'choropleth', encoding: { fill: { stat: 'density' } } }). See Multi-layer guide. |
| map.addLayer([value]) | Function | undefined | Add one layer to a multi-layer map and return the layer instance for chaining. Example: map.addLayer('choropleth').encoding('fill', { stat: 'density' }). See Multi-layer guide. |
Height note:
- If
heightis not set, eurostat-map computes it from viewport availability. containerIdshould be set only when you want the map to be constrained by a specific container’s height.- If your parent wrapper uses auto height (common with flex wrappers), avoid setting
containerIdunless that container has an explicit CSS height.
Map geography
Specify the NUTS geometries and the geographical extent of the map.
| Method | Type | Default value | Description |
|---|---|---|---|
| map.nutsLevel([value]) | int/string | 3 | The nuts level to show on the map, from 0 (national level) to 3 (more local level). Note that not all NUTS levels are always available for Eurostat databases. When using custom data sources and mixing different NUTS levels, set this option to “mixed” to show the different levels at once. |
| map.nutsYear([value]) | int | 2024 | The version of the NUTS dataset to use. Possible values are given in Nuts2json. Note that the default value will be adjusted in the future depending on the NUTS legislation in force. |
| map.geo([value]) | String | “EUR” | The map geographical territory, by default the entire European territory “EUR”. For world maps use “WORLD” and set proj to 54030. Note that world templates are currently only available for choropleth maps. Other possible values are given in Nuts2json. |
| map.proj([value]) | String | “3035” | The map projection EPSG code. For world maps: use 54030. Possible values are given in Nuts2json. Note that these values depend on the geographical territory. |
| map.scale([value]) | String | “20M” | The simplification level of the map, among “03M”, “10M”, “20M”, “60M” (for Europe). The most simplified version is “60M”. The level “01M” is also available for some geographical territories: For more information on possible values by geographical territory, see Nuts2json. |
| map.position([value]) | Object {x,y,z} | auto | The geographical coordinates of the position where to center the map view. These coordinates are expected to be expressed in the map projection. If not specified, a position is computed automatically. |
| map.defaultFitZoom([value]) | Number | 1.27 | Divides the exact bbox-fit pixel size used to compute the default position().z when it is left unset, so the default view is zoomed in tighter than an exact fit. Higher = more zoomed in by default; 1 = exact fit. |
| map.zoomExtent([value]) | Array | undefined | The zoom extent. The first value within [0,1] defines the maximum zoom out factor - the second value within [1,infinity] defines the maximum zoom in factor. Set to [1,1] to forbid zooming and allow panning. Set to null to forbid both. |
| map.filterGeometriesFunction | Function | (geometries) => geometries | You can manipulate the default geometries using your own custom function. For example to omit certain regions. |
World maps
It is also possible to build thematic world maps using eurostat-map. Simply pass “WORLD” to the map.geo() method. See this example for how to configure a world map.
| Method | Type | Default value | Description |
|---|---|---|---|
| map.projectionFunction([value]) | d3 projection | d3.geoRobinson() | Here you can define your own custom projection function for world maps |
Custom geometries
If you wish to make maps using your own custom geometries instead of NUTS regions, then you can specify them using:
.geometries([
    {
        id: 'regions',
        class: 'regions',
        statisticalRegions: true, // this is how eurostat-map knows what regions the statistical values belong to.
        features: myRegionsGeoJSON.features, // stats are linked via feature.properties.id
        onEach: (elements) => {
            // Add any D3 custom styling or behavior here
        },
    },
    {
        id: 'borders',
        features: myBordersGeoJSON.features,
        class: 'borders',
    },
])
| Method | Type | Default value | Description |
|---|---|---|---|
| map.geometries([value]) | Object[] | NUTS regions | Here you can define your own custom geometries to be used in your maps |
You can find a live example here (see the code)
Statistical data
The map statistical data can be accessed with the map.statData() method, which returns an object with the following methods:
| Method | Description |
|---|---|
| get([nutsId]) | Return the stat value {value,status} from a nuts id. If no argument is specified, returns the entire index. |
| getValue([nutsId]) | Return the stat value from a nuts id. |
| set([nutsId,stat]) | Set a stat value from a nuts id. The new statistical data format can be either {value:34.324,status:”e”} or just the value only. |
| setData([index]) | Set statistical data, already indexed by nutsId. The index has a structure like: { “PT”:0.2, “LU”:0.6, …}, or with status: { “PT”: {value:0.2, status:”e”}, “LU”:0.6, …} |
| getArray() | Return all stat values as an array. This can be used to classify the values. |
| getUniqueValues() | Return stat unique values. This can be used for categorical maps. |
| getMin() | Get minimum value. |
| getMax() | Get maximum value. |
| getMaxRegionId() | Get the NUTS id of the region with the highest value. |
| getMinRegionId() | Get the NUTS id of the region with the lowest value. |
| hasData() | Return true if data has been loaded. |
| isReady() | Return true if the data is ready to be used for rendering. |
| getTime() | Return the time stamp of the loaded Eurostat dataset (reflects the ‘time’ filter if set). |
| unitText([value]) | The text of the unit of measurement, to show in the tooltip. undefined by default. |
The map statistical data source can be accessed with the map.stat([value]) method. Several types of data sources are supported (see sections below).
Stat and encoding model
The preferred API separates dataset registration from visual mapping:
- Use
stat(...)to define named datasets. - Use
encoding(...)to bind those datasets to channels (fill,color,size,composition,x,y,opacity, etc.).
Example:
eurostatmap
    .map('proportionalSymbol')
    .stat('population', {
        eurostatDatasetCode: 'demo_r_pjangrp3',
        filters: { age: 'TOTAL', sex: 'T', unit: 'NR', time: '2023' },
        unitText: 'inhabitants',
    })
    .stat('gdpPerCapita', {
        eurostatDatasetCode: 'nama_10r_3gdp',
        filters: { unit: 'EUR_HAB', time: '2023' },
        unitText: 'EUR/inhabitant',
    })
    .encoding('size', { stat: 'population', scale: 'sqrt', range: [5, 30] })
    .encoding('color', { stat: 'gdpPerCapita', scale: 'quantile', classes: 5 })
Backward-compatible forms are still supported, including channel-named stats such as .stat('size', ...) and legacy positional composition signatures.
Eurostat database
Specify statistical data to be retrieved on-the-fly from Eurostat database. The query parameters can be retrieved from this page.
Example:
map = eurostatmap.map(...);
map.stat( {
	eurostatDatasetCode: "lfst_r_lfu3rt",
	filters:{
		age: "Y20-64",
		sex: "T",
		unit: "PC",
		time: "2019"
	}
});
| Parameter | Type | Default value | Description |
|---|---|---|---|
| eurostatDatasetCode | String | “demo_r_d3dens” | The Eurostat database code of the statistical variable. See here to find them. |
| filters | Object | { lastTimePeriod : 1 } | The Eurostat dimension codes to filter/select the chosen statistical variable. See here or here to find them. |
| precision | int | 2 | The precision of the statistical variable to retrieve (number of decimal places). |
CSV
Specify statistical data to be retrieved from CSV data.
Example:
map = eurostatmap.map(...);
map.stat( {
	csvURL: "https://raw.githubusercontent.com/eurostat/eurostat-map/master/examples/urb_rur_typo.csv",
	geoCol: "NUTS_ID_2013",
	valueCol: "urban_rural"
});
| Parameter | Type | Default value | Description |
|---|---|---|---|
| csvURL | String | undefined | The CSV file URL. |
| geoCol | String | “geo” | The column with the NUTS ids. |
| valueCol | String | “value” | The column with the statistical values. |
Custom JS
Specify statistical data region by region, from JavaScript code, or any kind of JSON data source.
Example:
map = eurostatmap.map(...);

//specify values region by region
map.statData().set("LU",500).set("DE",400).set("FR",100).set("IT",600)

//or in one time. Note that the 'status' can be specified but is not mandatory.
map.statData().setData({
	"FR": 10,
	"DE": {value:7,status:"e"},
	"UK": 12,
})
Map types
There are many different types of thematic maps that you can create using eurostat-map. Here you will find documentation on how to build them.
Choropleth map
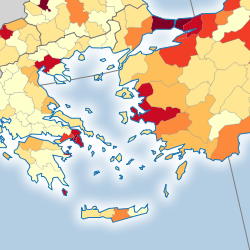
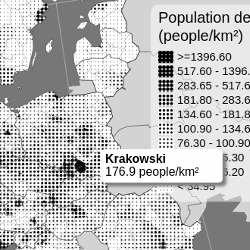
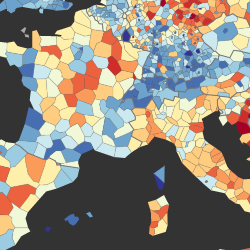
A choropleth map shows areas colored or patterned in proportion to a statistical variable. These maps should be used to show intensive statistical variables such as proportions, ratios, densities, rates of change, percentages, etc.
Here is an example with color value (see the code), another with a diverging color scheme (see the code), and a last one with a texture pattern (see the code).
Example:
eurostatmap
    .map('choropleth')
    .title('Population in Europe')
    .stat({ eurostatDatasetCode: 'demo_r_d3dens', unitText: 'inhab./km²' })
    .classificationMethod('threshold')
    .thresholds([50, 75, 100, 150, 300, 850])
    .tooltipShowFlags(false)
    .legend({ noData: false, decimals: 0, x: 15, y: 160 })
    .build()
| Method | Type | Default value | Description |
|---|---|---|---|
| map.numberOfClasses([value]) | int | 7 | The number of classes. When classificationMethod == “threshold”, this parameter is inferred from the number of breaks specified. |
| map.classificationMethod([value]) | String | “quantile” | The classification method. Possible values are “ckmeans”__“jenks”,“quantile”, “equinter” for equal intervals, and “threshold” for user defined threshol (see threshold method). |
| map.colors([value]) | Array | null | The colours to use for the classes. if unspecified, default colorFun is used. |
| map.thresholds([value]) | Array | [0] | If classificationMethod = “threshold”, the breaks of the classification. |
| map.makeClassifNice([value]) | boolean | false | Make nice break values. Works only for classificationMethod = “equinter”. |
| map.colorFunction([value]) | Function | built-in blue palette blend | The color function t => color (t in [0,1]). Can be a d3-scale-chromatic interpolator, or your own function. |
| map.classToFillStyle([value]) | Function | See description | A function returning a fill style for each class number. The default values is the function returned by eurostatmap.getColorFunction(colorFun()). |
| map.noDataFillStyle([value]) | String | “lightgray” | The fill style to be used for regions where no data is available. |
| map.categoryFillStyle([value]) | Object | undefined | Fill style for extra categorical values mixed into this choropleth’s classification, keyed by the raw data value (e.g. { '-': '#cccccc' }). Matching regions get their own legend/tooltip entry instead of being classified numerically or treated as generic “no data”. See Multi-Layer Stack Guide for why this exists instead of layering a categorical layer on top. |
| map.categoryText([value]) | Object | undefined | Legend/tooltip text for each extra category, keyed by the same raw data value as categoryFillStyle. Ex.: { '-': 'No railway lines' } |
| map.colorSchemeType([value]) | String | “discrete” | Discrete or continuous |
| map.valueTransform([value]) | Function | “(val)=>val” | Transform your data for distribution stretching when using continuous colour schemes. |
| map.valueUntransform([value]) | Function | “(val)=>val” | Unransform your data when distribution stretching when using continuous colour schemes to show true values in . |
| map.pointOfDivergence([value]) | number/null | null | Set point of divergence for diverging continuous color schemes. |
| map.skipNormalization([value]) | boolean | false | Skip normalization in continuous colour mode (useful when values are already normalized). |
Proportional symbol map
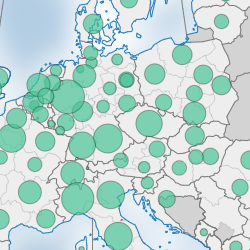
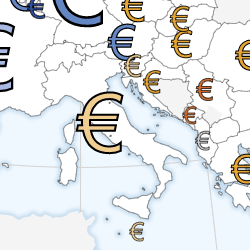
A proportional symbol map shows symbols (typically circles) sized in proportion to a statistical variable. These maps should be used to show statistical extensive variables such as quantities, populations, numbers, etc. Here is an example (see the code).
Example:
eurostatmap
    .map('proportionalSymbol')
    .nutsLevel(1)
    .stat({
        eurostatDatasetCode: 'demo_r_pjangrp3',
        filters: { age: 'TOTAL', sex: 'T', unit: 'NR', time: 2016 },
        unitText: 'inhabitants',
    })
    .psSettings({ maxSize: 25, stroke: '#fff', strokeWidth: 0.2, sizeScale: 'linear' })
    .psSettings({ fill: 'red' })
    .build()
Along with data-driven sizing, it is possible to colour symbols according to another variable. The preferred approach is to define named datasets and connect them through encoding(...):
    .stat('gdpPerInhabitant', { eurostatDatasetCode: 'nama_10r_3gdp', unitText: 'EUR/inhabitant', filters: { unit: 'EUR_HAB', time: '2018' } })
    .stat('totalGdp', { eurostatDatasetCode: 'nama_10r_3gdp', unitText: 'Million EUR', filters: { unit: 'MIO_EUR', time: '2018' } })
    .encoding('color', { stat: 'gdpPerInhabitant' })
    .encoding('size', { stat: 'totalGdp' })
Legacy channel-named datasets are still supported for backward compatibility:
    //GDP per inhabitant (colour of symbol)
    .stat("color", { eurostatDatasetCode: "nama_10r_3gdp", unitText: "EUR/inhabitant", filters: { unit: "EUR_HAB", time: "2018" } })
    // Total GDP (size of symbol)
    .stat("size", { eurostatDatasetCode: "nama_10r_3gdp", unitText: "Million EUR", filters: { unit: "MIO_EUR", time: "2018" } })
or with custom data:
map.statData('size').setData({ ES: 5, FR: 2, DE: 3 })
map.statData('color').setData({ ES: 2, FR: 7, DE: 5 })
It is also possible to prevent overlapping via the ‘dorling’ method:
.dorling(true)
and customise it with:
    .dorlingSettings({
        strength: { x: 1, y: 1 }, // forces applied during dorling simulation
        iterations: 1, // iterations of d3-force forceCollide
        worker: false, // use a web worker for (non-animated) dorling cartograms to not block the main thread
        onProgress: undefined, // track dorling progress when using web workers
    })
Proportional symbol style options can be configured in one call:
    .psSettings({
        stroke: '#fff',
        strokeWidth: 0.5,
        sizeScale: 'linear',
        minSize: 10,
        maxSize: 60,
        codeLabels: true,
    })
Please be aware that by using this method you will essentially be turning the map into a Cartogram. If deformation is high, please consider hiding the background elements/basemap.
| Method | Type | Default value | Description |
|---|---|---|---|
| map.psSettings([value]) | object | { stroke, strokeWidth, sizeScale, minSize, maxSize, codeLabels } | Grouped proportional-symbol settings. Supported keys: stroke, strokeWidth, sizeScale, minSize, maxSize, codeLabels. |
| map.psShape([value]) | string | circle | The shape of the symbol. Accepted values: circle, spike, bar, square, star, cross, diamond, triangle, wye or custom |
| map.psCustomShape([value]) | Object | null | A custom symbol to be used with d3.symbol when psShape is set to “custom”. See http://using-d3js.com/05_10_symbols.html#h_66iIQ5sJIT |
| map.psCustomSVG([value]) | Template Literal | null | Use this method for defining a custom SVG, which will be used as the proportional symbol. E.g. map.psSettings({ customSVG: <svg width="100" height="100"><rect width="100" height="100" /></svg> }). |
| map.psOffset([value]) | Object | {x:0,y:0} | Defines the offsets to apply to the symbols on the map. Only applicable to symbols where custom svgs are specified ( through psCustomSVG) |
| map.psMaxSize([value]) | number | 30 | Deprecated alias of psSettings({ maxSize }). The maximum size of the symbol. For shapes and vertical bars, this value is in pixels, but for psCustomSVG() it represents the scale factor of the transform applied to it. |
| map.psMinSize([value]) | number | 5 | Deprecated alias of psSettings({ minSize }). The minimum size / scale of the symbol. |
| map.psMaxValue([value]) | number | dataset’s maximum value | Manually set the maximum value of the data, for example to ensure different maps use the same size scale. |
| map.psMinValue([value]) | number | dataset’s minimum value | Manually set the minimum value of the data, for example to ensure different maps use the same size scale. |
| map.psBarWidth([value]) | number | 10 | Width in pixels of the vertical bars. Only to be used with a psShape of type “bar” |
| map.psFill([value]) | String | “#009569” | The fill color or pattern of the symbol, for when a colour scheme is not defined. |
| map.psFillOpacity([value]) | number | 1 | The opacity of the symbol, from 0 to 1. |
| map.psStrokeOpacity([value]) | number | 1 | The opacity of the symbol stroke, from 0 to 1. |
| map.psStroke([value]) | String | “#fff” | Deprecated alias of psSettings({ stroke }). The stroke color of the symbol. |
| map.psStrokeWidth([value]) | number | 0.2 | Deprecated alias of psSettings({ strokeWidth }). The width of the stroke. |
| map.psClasses([value]) | number | 5 | The number of classes to use when applying data-driven colour for the symbols. Similar to numberOfClasses() for choropleth maps. |
| map.psColorFun([value]) | function | d3.interpolateOrRd | The color function, as defined in d3-scale-chromatic |
| map.psSizeScale([value]) | string | ‘sqrt’ or ‘linear’ | Deprecated alias of psSettings({ sizeScale }). The D3 scale function used to define symbol sizes. |
| map.psClassificationMethod([value]) | String | “quantile” | The classification method. Possible values are “quantile”, “equinter” for equal intervals, and “threshold” for user defined threshold (see threshold method). |
| map.psThresholds([value]) | Array | [0] | If psClassificationMethod = “threshold”, the breaks of the classification. |
| map.psColors([value]) | Array | null | The colours to be using data-driven colour. The number of colours specified in the array should match the number of classes (specified using psClasses()) |
| map.psSpikeWidth([value]) | number | 7 | Width of spike symbols when psShape("spike") is used. |
| map.psCodeLabels([value]) | boolean | false | Deprecated alias of psSettings({ codeLabels }). Show region codes inside proportional symbols. |
| map.psBrightenFactor([value]) | number | 0.9 | Brightening factor used for region background color beneath symbols. |
| map.noDataFillStyle([value]) | String | “lightgray” | The fill style to be used for regions where no data is available. |
Proportional pie chart map
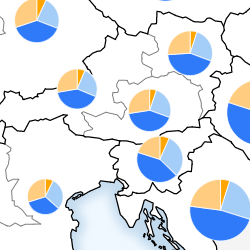
A proportional pie chart map shows pie charts sized in proportion to a statistical variable. The slices of the pie chart are made up of the different categories of that statistical variable. Here is an example (see the code).
Example:
// Population composition by age
eurostatmap
    .map('pie')
    .nutsLevel(3)
    .nutsYear(2016)
    .stat('composition', {
        eurostatDatasetCode: 'demo_r_pjanaggr3',
        filters: { sex: 'T', unit: 'NR', time: '2019' },
        unitText: 'people',
        categoryParameter: 'age',
        categoryCodes: ['Y_LT15', 'Y15-64', 'Y_GE65'],
        categoryLabels: ['< 15', '15 to 64', '> 65'],
        categoryColors: ['#33a02c', '#cab2d6', '#ff7f00'],
    })
    .encoding('composition', { stat: 'composition' })
    .legend({ x: 550, y: 200, sizeLegend: { title: 'Total Population' }, colorLegend: { title: 'Population by Age' } })
    .build()
Equivalent helper API:
//population composition by age
eurostatmap
    .map('pie')
    .nutsLevel(3)
    .nutsYear(2016)
    .statPie({
        eurostatDatasetCode: 'demo_r_pjanaggr3',
        filters: { sex: 'T', unit: 'NR', time: '2019' },
        unitText: 'people',
        categoryParameter: 'age',
        categoryCodes: ['Y_LT15', 'Y15-64', 'Y_GE65'],
        categoryLabels: ['< 15', '15 to 64', '> 65'],
        categoryColors: ['#33a02c', '#cab2d6', '#ff7f00'],
        preprocess: (regionId, value) => (regionId.endsWith('ZZ') ? null : value), // optional: filter/edit by region id and value
        transform: (v) => v / 1000, // optional: transform values after load
    })
    .legend({ x: 550, y: 200, sizeLegend: { title: 'Total Population' }, colorLegend: { title: 'Population by Age' } })
If the sum of the chosen categories does not represent the complete total, set totalCode in the same config object. For example, for causes of death, selected categories such as “Respiratory”, “Cancer”, and “Circulatory” do not cover all causes. In this case, set totalCode: 'A-R_V-Y'. The remaining share is then shown as “other” (configurable via compositionSettings({ otherText, otherColor })).
The same preprocess and transform options available in map.stat({...}) are also available in composition helpers (statPie, statWaffle, statBar, statStripe) and are applied to each generated category dataset (and total dataset when totalCode is used). preprocess runs first and receives (regionId, value).
All composition helpers also accept a customData option as an alternative to eurostatDatasetCode:
// Works the same for statBar, statWaffle and statStripe
.statPie({
    customData: {
        DE: { cat1: 45, cat2: 30, cat3: 25 },
        FR: { cat1: 60, cat2: 20, cat3: 20 },
        // etc.
    },
    categoryCodes: ['cat1', 'cat2', 'cat3'],
    categoryLabels: ['Category A', 'Category B', 'Category C'],
    categoryColors: ['#e41a1c', '#377eb8', '#4daf4a'],
    unitText: 'units',
})
Legacy positional helper signatures remain supported for backward compatibility.
To supply custom data directly without fetching from the Eurostat API, use the customData option in statPie:
eurostatmap
    .map('pie')
    .nutsLevel(0)
    .statPie({
        customData: {
            DE: { cereals: 45, oilseeds: 20, roots: 12, other: 23 },
            FR: { cereals: 60, oilseeds: 15, roots: 8, other: 17 },
            ES: { cereals: 38, oilseeds: 22, roots: 18, other: 22 },
            // etc.
        },
        categoryCodes: ['cereals', 'oilseeds', 'roots', 'other'],
        categoryLabels: ['Cereals', 'Oilseeds', 'Root crops', 'Other'],
        categoryColors: ['#e6c619', '#8DB600', '#a05d2b', '#aaaaaa'],
        unitText: '1 000 tonnes',
    })
    .build()
When customData is supplied, eurostatDatasetCode and categoryParameter are not required. An optional totalCode key inside each region object can be provided for the “other” wedge calculation; if omitted the total is auto-computed from the sum of categoryCodes.
| Method | Type | Default value | Description |
|---|---|---|---|
| map.compositionSettings([value]) | object | auto | Composition-level settings for chart symbols: type, radarValueMode (share or absolute), minSize, maxSize, strokeFill, strokeWidth, stripesOrientation, offsetAngle, agePyramidHeightFactor, otherColor, otherText. |
| map.pieSettings([value]) | object | auto | Pie-specific settings. Currently supports innerRadius to render donut charts. |
| map.catColors([value]) | object | auto | The colors of the slices, indexed by category code. If not specified, different colors are proposed. |
| map.catLabels([value]) | object | auto | The colors of the slices, indexed by category code. |
| map.showOnlyWhenComplete([value]) | boolean | false | Draw a region only when data is available for all categories. If one is missing, the region is considered as with ‘no data’. If not, the value of missing data is set to 0. |
| map.noDataFillStyle([value]) | string | “darkgray” | The fill style to be used for regions where no data is available. |
In addition to the default legend parameters, proportional pie chart maps have the these specific legend parameters:
Categorical map
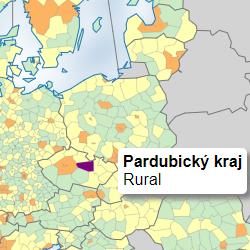
A categorical map shows areas according to categories (or discrete values). Here is an example of such map (see the code).
Example:
eurostatmap
    .map('categorical')
    .nutsYear(2013)
    .nutsLevel(3)
    .stat({
        csvURL: 'https://raw.githubusercontent.com/eurostat/eurostat-map/dev/examples/urb_rur_typo.csv',
        geoCol: 'NUTS_ID_2013',
        valueCol: 'urban_rural',
    })
    .classToFillStyle({ urb: '#fdb462', int: '#ffffb3', rur: '#ccebc5' })
    .classToText({ urb: 'Urban', int: 'Intermediate', rur: 'Rural' })
    .legend({ x: 10, y: 170, order: ['urb', 'int', 'rur'] })
    .build()
| Method | Type | Default value | Description |
|---|---|---|---|
| map.classToFillStyle([value]) | Object | auto | An object giving the fill style depending on the class code. If not specify, use default colors. |
| map.classToText([value]) | Object | auto | An object giving the legend label text depending on the class code. If not specified, use the class code. |
| map.noDataFillStyle([value]) | String | “lightgray” | The fill style to be used for regions where no data is available. |
In addition to the default legend parameters, categorical maps have these specific legend parameters:
Bivariate choropleth map
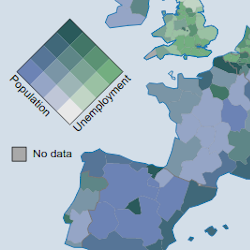
A bivariate choropleth map is a choropleth map showing the combination of two statistical variables. It shows how the correlation between these variables varies across space. Here is an example of such map (see the code).
Example:
eurostatmap
    .map('bivariateChoropleth')
    .nutsLevel(2)
    .nutsYear(2016)
    .stat('populationDensity', { eurostatDatasetCode: 'demo_r_d3dens', unitText: 'inh./km²' })
    .stat('unemploymentRate', {
        eurostatDatasetCode: 'lfst_r_lfu3rt',
        filters: { age: 'Y20-64', sex: 'T', unit: 'PC', time: 2017 },
        unitText: '%',
    })
    .encoding('x', { stat: 'populationDensity' })
    .encoding('y', { stat: 'unemploymentRate' })
    .numberOfClasses(4)
    .build()
| Method | Type | Default value | Description |
|---|---|---|---|
| map.numberOfClasses([value]) | int | 3 | The number of classes for the classification. The same value is used for both variables. |
| map.startColor([value]) | color | undefined | The color for lowest values of both variables. Set all four corner colors together to use a custom palette instead of the default oranges/blues blend. |
| map.color1([value]) | color | undefined | The color for the highest values of variable 1, and lowest of variable 2. |
| map.color2([value]) | color | undefined | The color for the highest values of variable 2, and lowest of variable 1. |
| map.endColor([value]) | color | undefined | The color for highest values of both variables. |
| map.classifier1([value]) | Function | auto | A function which returns a class number from a stat value. This allows you to set the class thresholds manually. |
| map.classifier2([value]) | Function | auto | A function which returns a class number from a stat value. This allows you to set the class thresholds manually. |
| map.breaks1([value]) | Array | undefined | Manual class breaks for variable 1 (used instead of quantiles). |
| map.breaks2([value]) | Array | undefined | Manual class breaks for variable 2 (used instead of quantiles). |
| map.classToFillStyle([value]) | Function | auto | A function returning the colors for each pair of classes i,j. |
| map.noDataFillStyle([value]) | color | “lightgray” | The fill style to be used for regions where no data is available. |
By default, bivariate maps read datasets v1 and v2. You can override this through encodings:
.encoding('x', { stat: 'myFirstDataset' })
.encoding('y', { stat: 'mySecondDataset' })
Trivariate choropleth map
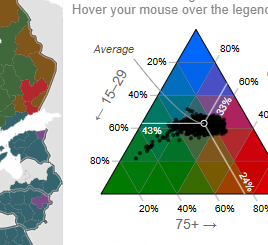
A trivariate choropleth map is a choropleth map showing the combination of three statistical variables. It shows how the correlation between these variables varies across space. Here is an example of such map (see the code).
Example:
const map = eurostatmap
    .map('trivariateChoropleth')
    .title('Age Structure')
    .subtitle('Population distribution by age groups, 2023')
    .nutsLevel(3)
    .stat('v1', {
        label: 'Population 15–29',
        eurostatDatasetCode: 'demo_r_pjanind3',
        filters: { indic_de: 'PC_Y15_29', time: 2023, unit: 'PC' },
        unitText: '%',
    })
    .stat('v2', {
        label: 'Population 45–64',
        eurostatDatasetCode: 'demo_r_pjanind3',
        filters: { indic_de: 'PC_Y45_64', time: 2023, unit: 'PC' },
        unitText: '%',
    })
    .stat('v3', {
        label: 'Population 75+',
        eurostatDatasetCode: 'demo_r_pjanind3',
        filters: { indic_de: 'PC_Y65_MAX', time: 2023, unit: 'PC' },
        unitText: '%',
    })
    .ternarySettings({
        hue: 160,
        chroma: 130,
        lightness: 40,
        contrast: 0,
        spread: 1.5,
        breaks: 5,
        meanCentering: true,
    })
    .legend({
        title: 'Age Structure',
        subtitle: `
            <tspan x="8" dy="0">Areas with more <tspan fill="#007b00" class='subtitle-color'>green</tspan> have a higher %</tspan>
            <tspan x="8" dy="1.2em"> of 15–29 year olds. Areas with more <tspan fill="#df0000" class='subtitle-color'>red</tspan> have </tspan>
            <tspan x="8" dy="1.2em">a higher % of 75+ year olds and areas with
            <tspan x="8" dy="1.2em">more <tspan fill="#0067ff" class='subtitle-color'>blue</tspan> have a higher</tspan> % of 45–64 year olds.</tspan>
            <tspan x="8" dy="1.2em">Hover your mouse over the legend to explore it.</tspan>
        `,
        x: 500,
        y: 3,
        boxOpacity: 0.99,
        width: 250,
        height: 280,
        labels: ['← 15–29 ', '← 45–64', '75+ →'],
        labelPosition: 'edge',
        padding: { top: 45, right: 30, bottom: 10, left: 30 },
        showLines: true,
        showCenter: true,
        centerLabel: 'Average',
        showData: true,
        colorTarget: 'triangles', // 'points' | 'triangles'
        centerAnnotationOffsets: { labelX: -70, labelY: 20, curveX: -20, curveY: 0 },
    })
    .build()
ternarySettings(...) supports two colour modes:
- Continuous/discrete
tricoloremode (default), usinghue,chroma,lightness,contrast,spreadandbreaks. tricoloreSextantmode, enabled withsextant: true, which classifies each region into one of six sextants around the ternary centre.
Example using sextant mode:
eurostatmap
    .map('trivariateChoropleth')
    .stat('bachelor', { label: 'Bachelor', unitText: '%' })
    .stat('master', { label: 'Master', unitText: '%' })
    .stat('phd', { label: 'PhD', unitText: '%' })
    .encoding('color', { type: 'trivariate', stats: ['bachelor', 'master', 'phd'] })
    .ternarySettings({
        sextant: true,
        meanCentering: true,
        sextantColors: ['#FFFF00', '#B3DCC3', '#01A0C6', '#B8B3D8', '#F11D8C', '#FFB3B3'],
    })
    .build()
When sextant: true is enabled, hue, chroma, lightness, contrast, spread and breaks are ignored for polygon colouring, but the legend still uses the current ternary centre.
| Method | Type | Default value | Description |
|---|---|---|---|
| map.ternaryCodes([value]) | string[] | [‘v1’, ‘v2’, ‘v3’] | Dataset keys used for ternary composition. |
| map.noDataFillStyle([value]) | string | “#ccc” | Fill style for regions with missing trivariate data. |
| map.ternarySettings([value]) | object | see defaults in example/code | Ternary colour settings object. |
ternarySettings keys: sextant, sextantColors, hue, chroma, lightness, contrast, spread, breaks, meanCentering.
By default, trivariate maps read datasets from ternaryCodes (['v1','v2','v3']). You can also bind them through:
.encoding('color', { type: 'trivariate', stats: ['datasetA', 'datasetB', 'datasetC'] })
Stripe composition map
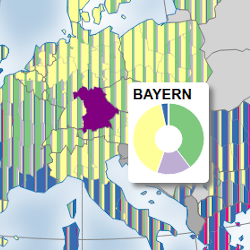
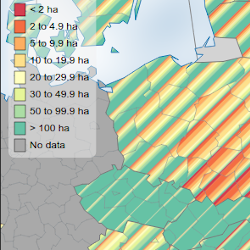
A stripe composition map is a choropleth map showing the composition of a statistical variable using a pattern of stripes of different colors and widths. The color of a stripe corresponds to its category, and its width is proportional to the share of this category in the total. A stripe composition map shows how proportions vary across space.
Here is an example of such map (see the code), and another one (see the code)
Example:
// Population composition by age
eurostatmap
    .map('stripe')
    .nutsLevel(3)
    .nutsYear(2016)
    .stripeSettings({ width: 10, orientation: 45 })
    .stat('composition', {
        eurostatDatasetCode: 'demo_r_pjanaggr3',
        filters: { sex: 'T', unit: 'NR', time: '2019' },
        unitText: 'people',
        categoryParameter: 'age',
        categoryCodes: ['Y_LT15', 'Y15-64', 'Y_GE65'],
        categoryLabels: ['< 15', '15 to 64', '> 65'],
        categoryColors: ['#33a02c', '#cab2d6', '#ff7f00'],
    })
    .encoding('composition', { stat: 'composition' })
    .legend({ x: 550, y: 10, title: 'Population by age' })
    .build()
Or simply:
// Population composition by age
eurostatmap
    .map('stripe')
    .nutsLevel(3)
    .nutsYear(2016)
    .stripeSettings({ width: 10, orientation: 45 })
    .statStripe({
        eurostatDatasetCode: 'demo_r_pjanaggr3',
        filters: { sex: 'T', unit: 'NR', time: '2019' },
        unitText: 'people',
        categoryParameter: 'age',
        categoryCodes: ['Y_LT15', 'Y15-64', 'Y_GE65'],
        categoryLabels: ['< 15', '15 to 64', '> 65'],
        categoryColors: ['#33a02c', '#cab2d6', '#ff7f00'],
    })
    .legend({ x: 550, y: 10, title: 'Population by age' })
| Method | Type | Default value | Description |
|---|---|---|---|
| map.stripeSettings([value]) | object | auto | Grouped stripe settings object with keys: width, orientation, otherColor, otherText. |
| map.stripeWidth([value]) | number | 50 | Deprecated alias of stripeSettings({ width }). |
| map.stripeOrientation([value]) | number | 0 | Deprecated alias of stripeSettings({ orientation }). |
| map.catColors([value]) | object | auto | The colors of the stripes, indexed by category code. If not specified, different colors are proposed. |
| map.catLabels([value]) | object | auto | The labels of the stripes, indexed by category code. |
| map.showOnlyWhenComplete([value]) | boolean | false | Draw a region only when data is available for all categories. If one is missing, the region is considered as with ‘no data’. If not, the value of missing data is set to 0. |
| map.noDataFillStyle([value]) | string | “lightgray” | The fill style to be used for regions where no data is available. |
| map.pieChartRadius([value]) | number | 40 | Radius of the pie chart to show in the tooltip. |
| map.pieChartInnerRadius([value]) | number | 15 | Inner radius of the pie chart to show in the tooltip. |
| map.stripeOtherColor([value]) | string | auto | Deprecated alias of stripeSettings({ otherColor }). |
| map.stripeOtherText([value]) | string | “other” | Deprecated alias of stripeSettings({ otherText }). |
| map.stripeTotalCode([value]) | string | undefined | Category code used as the total reference when computing shares/other. |
| map.statCodes([value]) | string[] | undefined | Explicit stat code order used by composition rendering/legends. |
In addition to the default legend parameters, stripe composition maps have the following specific legend parameters:
| Method | Type | Default value | Description |
|---|---|---|---|
| map.shapeWidth([value]) | number | 13 | Width of the legend box elements. |
| map.shapeHeight([value]) | number | 15 | Height of the legend box elements. |
| map.shapePadding([value]) | number | 5 | Distance between consecutive legend box elements. |
| map.labelFontSize([value]) | int | 12 | Font size of the legend label. |
| map.labelOffset([value]) | number | 5 | Distance between the legend box elements to the corresponding text label. |
| map.noData([value]) | boolean | true | Show/hide ‘no data’ legend box element. |
| map.noDataText([value]) | string | “No data” | ‘No data’ label text. |
Sparkline map
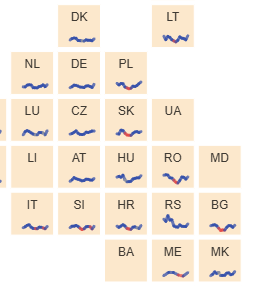
A sparkline is a very small line chart, typically drawn without axes or coordinates. It presents the general shape of the variation (typically over time) in some measurement, such as temperature, in a simple and highly condensed way. A chart is drawn for each region showing the temporal variations of each.
Here is an example of such map (see the code)
Example:
eurostatmap
    .map('sparkline')
    .nutsLevel(1)
    .stat({
        eurostatDatasetCode: 'demo_r_pjanaggr3',
        filters: { sex: 'T', unit: 'NR' },
        unitText: 'people',
        preprocess: (regionId, value) => (regionId.startsWith('FRY') ? null : value), // optional: filter/edit by region id and value
        transform: (v) => v / 1000, // optional: transform values after load
        dates: ['2009', '2010', '2011', '2012', '2013', '2014', '2015', '2016', '2017', '2018', '2019'],
        labels: ['2009', '2010', '2011', '2012', '2013', '2014', '2015', '2016', '2017', '2018', '2019'],
    })
    .sparkSettings({
        type: 'area',
        lineWidth: 70,
        lineHeight: 20,
        lineOpacity: 0.9,
    })
    .build()
statSpark({...}) also supports preprocess and transform, identical to map.stat({...}). preprocess runs first and receives (regionId, value).
stat({...}) also supports customData for sparklines. When using stat({...}), provide an explicit dates array so the sparkline engine can register one series per date:
.stat({
    customData: {
        DE: { '2020': 200, '2021': 190, '2022': 210, '2023': 205 },
        FR: { '2020': 150, '2021': 160, '2022': 155, '2023': 170 },
        // etc.
    },
    dates: ['2020', '2021', '2022', '2023'],
    labels: ['2020', '2021', '2022', '2023'], // optional display labels
    unitText: 'people',
})
statSpark({...}) remains supported for backward compatibility and can infer dates from customData when dates is omitted.
| Method | Type | Default | Description |
|---|---|---|---|
| map.sparkSettings([value]) | object | { type:’line’, lineOffsets:{x:0,y:0}, lineWidth:30, lineHeight:20, lineStrokeWidth:0.4, lineOpacity:0.6, lineColor:’black’, areaColor:’#41afaa’, lineCircleRadius:0, tooltipChart:{ width:150, height:80, margin:{left:40,right:20,top:10,bottom:40}, circleRadius:1.5 } } | Grouped sparkline settings. Supported keys: type, lineOffsets, lineWidth, lineHeight, lineStrokeWidth, lineOpacity, lineColor, areaColor, lineCircleRadius, tooltipChart, lineChartFunction. |
| map.sparkType([value]) | string | “line” | Deprecated alias of sparkSettings({ type }). Type of chart to use (line, area, bar). |
| map.sparkLineColor([value]) | string / Function | “black” | Deprecated alias of sparkSettings({ lineColor }). Also accepts an accessor function. |
| map.sparkLineAreaColor([value]) | string / Function | “#41afaa” | Deprecated alias of sparkSettings({ areaColor }). Also accepts an accessor function. |
| map.sparkLineWidth([value]) | number | 30 | Deprecated alias of sparkSettings({ lineWidth }). |
| map.sparkLineHeight([value]) | number | 20 | Deprecated alias of sparkSettings({ lineHeight }). |
| map.sparkLineStrokeWidth([value]) | number | 0.4 | Deprecated alias of sparkSettings({ lineStrokeWidth }). |
| map.sparkLineOpacity([value]) | number | 0.6 | Deprecated alias of sparkSettings({ lineOpacity }). |
| map.sparkLineCircleRadius([value]) | number | 0 | Deprecated alias of sparkSettings({ lineCircleRadius }). |
| map.sparkTooltipChart([value]) | object | { width:150, height:80, margin:{ left:40, right:20, top:10, bottom:40 }, circleRadius:1.5 } | Deprecated alias of sparkSettings({ tooltipChart }). |
| map.sparkLineChartFunction([value]) | function | undefined | Deprecated alias of sparkSettings({ lineChartFunction }). Custom renderer signature: (node, data, width, height, isForTooltip). |
| map.sparkLineOffsets([value]) | object {x,y} | {x:0,y:0} | Deprecated alias of sparkSettings({ lineOffsets }). |
| map.showOnlyWhenComplete([value]) | boolean | false | Draw region charts only when data is complete for all expected records. |
| map.sparklineData([value]) | object | undefined | Provide sparkline data directly instead of fetching via Eurostat. |
Flow map
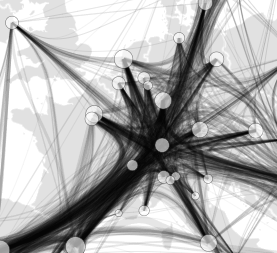
Here is an example of such map (see the code)
const exampleGraph = {
    nodes: [
        // the ids of the nodes and links correspond with the ids of the map's statistical regions (e.g. NUTS id)
        { id: 'FR' },
        { id: 'DE' },
        { id: 'IT' },
        { id: 'ES' },
        { id: 'BE' },
        // alternatively, specify custom nodes with their own x/y
        { id: 'Custom', x: 420000, y: 320000 },
    ],
    links: [
        { source: 'FR', target: 'DE', value: 8201 },
        { source: 'FR', target: 'IT', value: 4969 },
        { source: 'FR', target: 'ES', value: 4542 },
        { source: 'FR', target: 'BE', value: 4303 },
        { source: 'FR', target: 'Custom', value: 3445 },
    ],
}

const map = eurostatmap
    .map('flow')
    .flowGraph(exampleGraph)
    .nutsLevel(0)
    .flowSettings({ color: '#72bb6f' }) // can be a function
    .flowSettings({ regionColors: ['#bbd7ee', '#c7e3c6'] }) // origins, destinations
    .flowSettings({
        regionLabels: ['importer', 'exporter'],
        arrows: false,
        outlines: true,
        outlineWidth: 1,
        outlineColor: 'white',
        colorGradient: true,
        maxWidth: 40,
        minWidth: 1,
    })

    .build()
| Method | Type | Default | Description |
|---|---|---|---|
| map.flowGraph([value]) | Object | undefined | Graph object with nodes and links defining flow data. |
| map.flowSettings([value]) | object | auto | Grouped flow settings object. Keys: color, regionColors, regionLabels, arrows, arrowScale, maxWidth, minWidth, outlines, outlineWidth, outlineColor, colorGradient, opacityGradient, widthGradient, stack, nodes, nodeType, labelOffsets, lineType, nodeSizeScale, opacity, internal, topLocations, topLocationsType, curvatureSettings, order, widthGradientSettings, bidirectional, edgeBundling, bundleSettings. |
| map.flowColor([value]) | string/function | '#848484ff' |
Deprecated alias of flowSettings({ color }). |
| map.flowArrows([value]) | boolean | false | Deprecated alias of flowSettings({ arrows }). |
| map.flowOutlines([value]) | boolean | true | Deprecated alias of flowSettings({ outlines }). |
| map.flowColorGradient([value]) | boolean | false | Deprecated alias of flowSettings({ colorGradient }). |
| map.flowOpacityGradient([value]) | boolean | false | Deprecated alias of flowSettings({ opacityGradient }). |
| map.flowWidthGradient([value]) | boolean | false | Deprecated alias of flowSettings({ widthGradient }). |
| map.flowMaxWidth([value]) | number | 30 | Deprecated alias of flowSettings({ maxWidth }). |
| map.flowMinWidth([value]) | number | 1 | Deprecated alias of flowSettings({ minWidth }). |
| map.flowLineType([value]) | string | ‘curved’ | Deprecated alias of flowSettings({ lineType }). |
| map.flowStack([value]) | boolean | true | Deprecated alias of flowSettings({ stack }). |
| map.flowLabelOffsets([value]) | object {x,y} | { x: 3, y: 0 } | Deprecated alias of flowSettings({ labelOffsets }). |
| map.flowRegionColors([value]) | array | [‘#bbd7ee’, ‘#c7e3c6’] | Deprecated alias of flowSettings({ regionColors }). |
| map.flowRegionLabels([value]) | array | [‘Exporter’, ‘Importer’] | Deprecated alias of flowSettings({ regionLabels }). |
| map.flowOpacity([value]) | number | 0.9 | Deprecated alias of flowSettings({ opacity }). |
| map.flowArrowScale([value]) | number | 0.7 | Deprecated alias of flowSettings({ arrowScale }). |
| map.flowNodes([value]) | boolean | false | Deprecated alias of flowSettings({ nodes }). |
| map.flowNodeType([value]) | string | ‘circle’ | Deprecated alias of flowSettings({ nodeType }). |
| map.flowTopLocations([value]) | number | 0 | Deprecated alias of flowSettings({ topLocations }). |
| map.flowTopLocationsType([value]) | string | ‘destination’ | Deprecated alias of flowSettings({ topLocationsType }). |
| map.flowCurvatureSettings([value]) | object | { gapX: 10, padX: 2, padY: 2, bumpY: 1, curvature: 0.5 } | Deprecated alias of flowSettings({ curvatureSettings }). |
| map.flowOrder([value]) | function | (a,b) => a.otherY - b.otherY |
Deprecated alias of flowSettings({ order }). |
| map.flowWidthGradientSettings([value]) | object | { startRatio: 0.25, samples: 48, minStartWidth: 1.5, capEnd: true, curvatureFollow: true } | Deprecated alias of flowSettings({ widthGradientSettings }). |
| map.flowBidirectional([value]) | boolean | true | Deprecated alias of flowSettings({ bidirectional }). |
| map.flowEdgeBundling([value]) | boolean | false | Deprecated alias of flowSettings({ edgeBundling }). |
| map.flowBundleSettings([value]) | object | { alphaDecay: 0.1, chargeStrength: 10, distanceMax: null, linkStrength: 0.7, linkIterations: 1 } | Deprecated alias of flowSettings({ bundleSettings }). |
flowDonuts() remains available as a deprecated alias. Prefer flowSettings({ nodes: true, nodeType: 'donut' }).
Coxcomb map
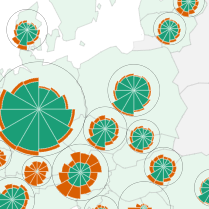
Example:
const map = eurostatmap
    .map('coxcomb')
    .dorling(true)
    .title('Tourism')
    .subtitle('Total nights spent, 2022')
    .scale('60M')
    .nutsLevel(1)
    .statCoxcomb({
        stat: {
            //data/tour_occ_nin2m?format=JSON&unit=NR&c_resid=TOTAL&nace_r2=I551-I553&month=M01&lang=EN
            eurostatDatasetCode: 'tour_occ_nin2m',
            filters: { unit: 'NR', nace_r2: 'I551-I553', TIME: 2022 }, // shared filters
            unitText: 'Nights spent',
        },
        timeParameter: 'month',
        times: ['M01', 'M02', 'M03', 'M04', 'M05', 'M06', 'M07', 'M08', 'M09', 'M10', 'M11', 'M12'],
        timeLabels: ['Jan', 'Feb', 'Mar', 'Apr', 'May', 'Jun', 'Jul', 'Aug', 'Sep', 'Oct', 'Nov', 'Dec'],
        categoryParameter: 'c_resid',
        categoryCodes: ['DOM', 'FOR'],
        categoryLabels: ['Domestic', 'Foreign'],
        categoryColors: ['#1b9e77', '#d95f02'],
        totalCode: 'TOTAL',
    })
    .coxcombSettings({ minRadius: 5, maxRadius: 37 })
    .legend({
        svgId: 'legend',
        title: 'Nights spent',
        x: 50,
        y: 120,
        colorLegend: { title: 'Type', marginTop: 50, noData: false },
        timeLegend: { title: 'Month', marginTop: -30 },
    })
    .build()
| Method | Type | Default value | Description |
|---|---|---|---|
| map.coxcombSettings([value]) | object | auto | Grouped coxcomb settings object with keys: minRadius, maxRadius, strokeFill, strokeWidth, rings, offsets. |
| map.coxcombMinRadius([value]) | number | auto | Deprecated alias of coxcombSettings({ minRadius }). |
| map.coxcombMaxRadius([value]) | number | auto | Deprecated alias of coxcombSettings({ maxRadius }). |
| map.coxcombStrokeFill([value]) | string | auto | Deprecated alias of coxcombSettings({ strokeFill }). |
| map.coxcombStrokeWidth([value]) | number | auto | Deprecated alias of coxcombSettings({ strokeWidth }). |
| map.coxcombRings([value]) | boolean | auto | Deprecated alias of coxcombSettings({ rings }). |
| map.coxcombOffsets([value]) | object {x,y} | {x:0,y:0} | Deprecated alias of coxcombSettings({ offsets }). |
| map.hoverColor([value]) | string | auto | Hover fill color for highlighted regions/symbols. |
| map.classifierSize([value]) | function | auto | Override size classifier function for symbol sizing. |
| map.catColors([value]) | object | auto | Category colors used in the coxcomb chart wedges. |
| map.catLabels([value]) | object | auto | Category labels used in legends/tooltips. |
| map.noDataFillStyle([value]) | string | “lightgray” | Fill style for regions with no data. |
Mushroom map
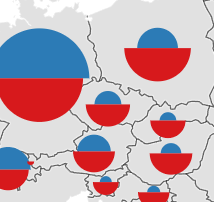
Example:
const map = eurostatmap
    .map('mushroom')
    .dorling(true) // prevents overlapping using d3-force
    .mushroomSettings({ orientation: 'vertical' })
    .nutsLevel(2)
    .stat('v1', {
        eurostatDatasetCode: 'demo_r_pjangrp3',
        filters: { age: 'TOTAL', sex: 'T', unit: 'NR', time: '2023' },
        unitText: 'inhabitants',
    })
    .stat('v2', {
        eurostatDatasetCode: 'nama_10r_3gdp',
        unitText: 'Euro per inhabitant',
        filters: { unit: 'EUR_HAB', time: '2022' },
    })
    // you can define independent sizing functions for each semi-circle like so:
    .mushroomSettings({
        sizeScaleFunctionV1: function (value) {
            // custom size scale function for v1 side
            return Math.sqrt(value) * 0.02
        },
        sizeScaleFunctionV2: function (value) {
            // custom size scale function for v2 side
            return Math.cbrt(value) * 0.08
        },
    })
    .build()
| Method | Type | Default value | Description |
|---|---|---|---|
| map.mushroomSettings([value]) | object | auto | Grouped mushroom settings object with keys: codes, minSize, maxSize, colors, orientation, sizeScaleFunction, sizeScaleFunctionV1, sizeScaleFunctionV2. |
| map.mushroomCodes([value]) | [string,string] | [‘v1’,’v2’] | Deprecated alias of mushroomSettings({ codes }). |
| map.mushroomMinSize([value]) | number | auto | Deprecated alias of mushroomSettings({ minSize }). |
| map.mushroomMaxSize([value]) | number | auto | Deprecated alias of mushroomSettings({ maxSize }). |
| map.mushroomColors([value]) | [string,string] | auto | Deprecated alias of mushroomSettings({ colors }). |
| map.mushroomOrientation([value]) | string | “vertical” | Deprecated alias of mushroomSettings({ orientation }). |
| map.mushroomSizeScaleFunction([value]) | function | auto | Deprecated alias of mushroomSettings({ sizeScaleFunction }). |
| map.mushroomSizeScaleFunctionV1([value]) | function | auto | Deprecated alias of mushroomSettings({ sizeScaleFunctionV1 }). |
| map.mushroomSizeScaleFunctionV2([value]) | function | auto | Deprecated alias of mushroomSettings({ sizeScaleFunctionV2 }). |
Waffle map
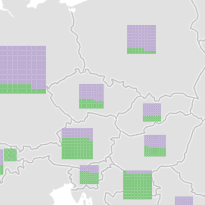
const map = eurostatmap
    .map('waffle')
    .title('Tourism')
    .subtitle('Nights spent in tourist accommodation, 2022')

    // waffle settings
    .waffleSettings({
        minSize: 10,
        maxSize: 40,
        gridSize: 10, // cells per row
        cellPadding: 0,
        strokeFill: 'white',
        strokeWidth: 0,
        roundedCorners: 0,
        tooltipSize: 100, // tooltip chart size
        otherColor: '#FFCC80',
        otherText: 'Other',
    })

    .nutsLevel(0)
    .statWaffle({
        eurostatDatasetCode: 'tour_occ_nin2',
        filters: { unit: 'NR', time: '2022', nace_r2: 'I551-I553' },
        unitText: 'nights spent',
        categoryParameter: 'c_resid',
        categoryCodes: ['FOR', 'DOM'],
        categoryLabels: ['Foreign', 'Domestic'],
        categoryColors: ['#7fc97f', '#beaed4', '#666666'], //colours,
        //totalCode: 'TOTAL',
    })

    .legend({
        x: 10,
        y: 150,
        boxOpacity: 0.8,
        boxFill: 'white',
        sizeLegend: { title: 'Nights spent', titlePadding: 15 },
        colorLegend: { title: 'Tourist origin', noData: false },
    })

    .build()
Legacy waffle-prefixed setters (for example, .waffleMinSize() and .waffleGridSize()) are still supported for backward compatibility but are deprecated. Use .waffleSettings({...}) instead.
| Method | Type | Default value | Description |
|---|---|---|---|
| map.waffleSettings([value]) | object | auto | Waffle settings object with keys: minSize, maxSize, gridSize, cellPadding, strokeFill, strokeWidth, roundedCorners, tooltipSize, otherColor, otherText. |
| map.catColors([value]) | object | auto | Category colors for waffle cells. |
| map.catLabels([value]) | object | auto | Category labels for legends/tooltips. |
| map.showOnlyWhenComplete([value]) | boolean | false | Draw region only when all category values are available. |
| map.noDataFillStyle([value]) | string | “#bcbcbc” | Fill style for regions where no data is available. |
| map.dorling([value]) | boolean | false | Apply dorling collision handling to waffle symbols. |
| map.waffleTotalCode([value]) | string | undefined | Total code used to compute optional “other” share. |
| map.statCodes([value]) | string[] | undefined | Explicit stat code order used by composition rendering/legends. |
Bar chart map
A bar chart map shows proportional bar charts positioned at region centroids. The library supports two layout modes:
- Stacked bars (horizontal): Bar width scales with the region total; colored segments represent category shares left-to-right. Good for comparing totals and composition simultaneously.
- Grouped bars (vertical): Each category gets its own vertical bar; bar height scales with the individual category value. Good for comparing absolute category values across regions.
Here is an example of such map (see the code).
Example (stacked horizontal bars):
const map = eurostatmap
    .map('bar')
    .title('Tourism')
    .subtitle('Nights spent in tourist accommodation, 2022')
    .nutsLevel(0)
    .statBar({
        eurostatDatasetCode: 'tour_occ_nin2',
        filters: { unit: 'NR', time: '2022', nace_r2: 'I551-I553' },
        unitText: 'nights spent',
        categoryParameter: 'c_resid',
        categoryCodes: ['FOR', 'DOM'],
        categoryLabels: ['Foreign', 'Domestic'],
        categoryColors: ['#7fc97f', '#beaed4'],
        totalCode: 'TOTAL',
    })
    .barSettings({
        type: 'stacked',
        maxWidth: 40,
        minWidth: 10,
        height: 8,
    })
    .legend({
        x: 10,
        y: 150,
        colorLegend: { title: 'Tourist origin', noData: false },
    })
    .build()
Example (grouped vertical bars):
const map = eurostatmap
    .map('bar')
    .barSettings({
        type: 'grouped',
        groupWidth: 6,
        groupMaxHeight: 40,
    })
    .statBar({
        eurostatDatasetCode: 'demo_r_pjanaggr3',
        filters: { sex: 'T', unit: 'NR', time: '2019' },
        unitText: 'people',
        categoryParameter: 'age',
        categoryCodes: ['Y_LT15', 'Y15-64', 'Y_GE65'],
        categoryLabels: ['< 15', '15 to 64', '> 65'],
        categoryColors: ['#33a02c', '#cab2d6', '#ff7f00'],
    })
    .build()
The statBar helper also supports customData and transform options, identical to statPie and statWaffle:
.statBar({
    customData: {
        DE: { cat1: 45, cat2: 30, cat3: 25 },
        FR: { cat1: 60, cat2: 20, cat3: 20 },
        // etc.
    },
    categoryCodes: ['cat1', 'cat2', 'cat3'],
    categoryLabels: ['Category A', 'Category B', 'Category C'],
    categoryColors: ['#e41a1c', '#377eb8', '#4daf4a'],
    unitText: 'units',
    transform: (v) => v / 1000, // optional: transform values after load
})
| Method | Type | Default value | Description |
|---|---|---|---|
| map.barSettings([value]) | object | {type:'grouped', minWidth:10, maxWidth:40, height:8, groupWidth:6, groupGap:0, groupMinHeight:2, groupMaxHeight:40, strokeFill:'white', strokeWidth:0.3, cornerRadius:1, otherColor:'#FFCC80', otherText:'Other', tooltipWidth:150, tooltipHeight:20} |
Bar chart settings object. Use this to configure all bar-related visual properties in one place. |
| map.catColors([value]) | object | auto | Category colors indexed by category code. |
| map.catLabels([value]) | object | auto | Category labels indexed by category code. |
| map.showOnlyWhenComplete([value]) | boolean | false | Draw region only when all category values are available. |
| map.noDataFillStyle([value]) | string | “lightgray” | Fill style for regions where no data is available. |
| map.dorling([value]) | boolean | false | Apply dorling collision handling to bar chart symbols. |
| map.barTotalCode([value]) | string | undefined | Total code used to compute optional “other” share (similar to waffle/pie totalCode). |
| map.statCodes([value]) | string[] | undefined | Explicit stat code order used by composition rendering/legends. |
Legacy individual setters (e.g., barType(), barMaxWidth(), etc.) are still supported for backward compatibility but deprecated. Use barSettings({...}) instead.
Cartograms
As of version 4.1.0 you can now create grid cartograms and dorling cartograms by using the following functions:
Grid Cartograms
map.gridCartogram(true)
Configure shape, margins, cell spacing and optional custom positions with a single settings object:
map.gridCartogramSettings({
    shape: 'hexagon', // or 'square'
    margins: { top: 100, right: 10, bottom: 10, left: 10 },
    cellPadding: 5,
    chartOffset: { x: 0, y: 0 }, // optional offset for chart-based cartograms in each cell
})
If you wish, you can define custom grid positions using positions:
map.gridCartogramSettings({
    positions: `,IS,  ,  ,  ,NO,SE,FI,  ,  ,  ,  ,
    ,  ,  ,  ,  ,  ,  ,  ,EE,  ,  ,  ,
    ,  ,  ,  ,  ,  ,  ,  ,LV,  ,  ,  ,
    ,IE,UK,  ,  ,DK,  ,LT,  ,  ,  ,  ,
    ,  ,  ,  ,NL,DE,PL,  ,  ,  ,  ,  ,
    ,  ,  ,BE,LU,CZ,SK,UA,  ,  ,  ,  ,
    ,  ,FR,CH,LI,AT,HU,RO,MD,  ,  ,  ,
    ,PT,ES,  ,IT,SI,HR,RS,BG,  ,  ,  ,
    ,  ,  ,  ,  ,  ,BA,ME,MK,  ,  ,  ,
    ,  ,  ,  ,  ,  ,  ,AL,EL,TR,  ,  ,
    ,  ,  ,  ,MT,  ,  ,  ,  ,CY,  ,  ,`,
})
Legacy setters such as gridCartogramShape, gridCartogramMargins, gridCartogramCellPadding and gridCartogramPositions are still available for backward compatibility but are deprecated.
Here is an example of such map (see the code)
Dorling Cartograms
Can be used like so for maps with proportional symbols and charts:
map.dorling(true)
and customised like so:
.dorlingSettings({
    strength: { x: 1, y: 1 }, // forces applied during dorling simulation
    iterations: 1, // iterations of d3-force forceCollide
    worker: false, // use a web worker for (non-animated) dorling cartograms to not block the main thread
    onProgress: undefined, // track dorling progress when using web workers
})
removing the background map is optional but recommended:
map.backgroundMap(false)
you can toggle the region code being shown inside the proportional symbols with:
map.psSettings({ codeLabels: true })
Map texts
Here you can find all the different texts you can add to the map.
Map title & subtitle
Specify the map title, its style and position.
| Method | Type | Default value | Description |
|---|---|---|---|
| map.title([value]) | String | ”” | The title text. |
| map.titlePosition([value]) | Array ([x,y]) | auto | The title position. If not specified, a position is automatically computed, on the top left corner. |
| map.subtitle([value]) | String | ”” | The subtitle text. |
| map.subtitlePosition([value]) | Array ([x,y]) | auto | The subtitle position. If not specified, a position is automatically computed, on the top left corner. |
Labelling
You can customise the labels shown on the map using the following settings:
map = eurostatmap.map(...)
	.labels({
        labels: [
            { text: 'Test label', x: 3500000, y: 4260000, class: 'test' },
            { text: 'MEDITERRANEAN SEA', x: 5472000, y: 1250000, class: 'ocean', letterSpacing: 7 },
            { text: 'ATLANTIC OCEAN', x: 2700000, y: 2650000, class: 'ocean', letterSpacing: 2 },
            { text: 'NORTH SEA', x: 3915000, y: 3700000, class: 'ocean' },
            { text: 'BALTIC SEA', x: 4840000, y: 3600000, class: 'ocean', rotate: -30 },
            { text: 'NORWEGIAN SEA', x: 3850000, y: 4800000, class: 'ocean', letterSpacing: 1 },
            { text: 'BLACK SEA', x: 6300000, y: 2500000, class: 'ocean', letterSpacing: 4 },
        ],
        values: true, // label statistical values directly
        // Choose one readability treatment for all geographic and value labels:
        backgrounds: true,
        halos: false,
        processValueLabelCentroids: (region, centroid) => {
            // (optional) adjust NUTS1 label positions manually to avoid overlapping
            if (region.properties.id == 'ES4') {
                return [centroid[0] - 10, centroid[1] + 19]
            } else if (region.properties.id == 'DE4') {
                return [centroid[0] + 4, centroid[1] + 8]
            }
            return centroid
        },
        statLabelsFilterFunction: (region, map) => {
            // filter the statistical value labels
            const data = map.statData()
            const statValue = data.get(region.properties.id)
            if (!statValue || (!statValue.value && statValue.value !== 0)) {
                return false
            } else {
                return true
            }
        }
    })
You can use the ‘class’ attribute to customise the labels accordingly (e.g. class: ‘ocean’ can be styled with .em-label-ocean).
These are the default classes used to style the labels:
#em-labels
.em-stat-label
.em-stat-label-shadow
.em-label-cc
.em-label-shadow-cc
.em-label-countries
.em-label-shadow-countries
.em-label-seas
.em-label-shadow-seas
.em-flow-labels
.em-flow-label
.em-flow-label-shadow
Locations
You can add locations as points with labels to your map like so:
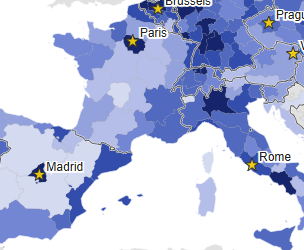
const capitals = [
    { lon: 2.35, lat: 48.85, label: 'Paris' },
    { lon: 13.41, lat: 52.52, label: 'Berlin' },
    { lon: -0.12, lat: 51.5, label: 'London' },
    { lon: 12.5, lat: 41.9, label: 'Rome' },
    { lon: -3.7, lat: 40.42, label: 'Madrid' },
    { lon: 4.35, lat: 50.85, label: 'Brussels' },
    { lon: 18.91, lat: 47.49, label: 'Budapest' },
    { lon: 21.01, lat: 52.23, label: 'Warsaw' },
    { lon: 14.42, lat: 50.09, label: 'Prague' },
    { lon: 16.37, lat: 48.21, label: 'Vienna' },
]

const map = eurostatmap
    .map('choropleth')
    .nutsLevel(2)
    .title('Population density, 2023')
    .stat({ eurostatDatasetCode: 'demo_r_d3dens', unitText: 'people/km²', filters: { TIME: '2023' } })
    .zoomExtent([1, 1000])
    .build()

map.onBuild(() => {
    capitals.forEach(({ lon, lat, label }) => {
        const [x, y] = eurostatmap.projectToMap(map, lon, lat)
        map.addLocation({
            // Required
            x,
            y,
            // Optional core settings
            id: `capital-${label.toLowerCase()}`, // Auto-generated if omitted
            label,
            shape: 'star', // 'circle'|'square'|'pin'|'diamond'|'cross'|'star'
            radius: 7,
            fill: '#FFD700',
            opacity: 0.9,
            stroke: '#333',
            strokeWidth: 1,
            // Label positioning and styling
            labelOffset: [7, -6], // [dx, dy] from point in px
            labelStyle: {
                fontSize: '12px',
                fontFamily: 'inherit',
                fontWeight: 'normal',
                fill: '#222',
                opacity: 1,
                haloColor: '#fff',
                haloWidth: 3,
                textAnchor: 'start',
            },
        })
    })
}).build()
Annotations
You can add annotations to the map using d3-svg-annotation objects like so:
// see d3-svg-annotation for how to define them:
const annotations = [
    {
        note: {
            label: 'This is an annotation',
            title: 'annotationLabel',
            wrap: 150,
        },
        connector: {
            end: 'dot',
            type: 'curve',
            points: [
                [120, 14],
                [190, 52],
            ],
        },
        x: 370,
        y: 100,
        dy: 120,
        dx: 240,
    },
]

const map = eurostatmap
    .map('choropleth')
    .annotations({
        editMode: false,
        annotations: annotations,
    })
    .build()
Stamps
Stamps are intended to be used to highlight a particular value, usually the EU average:
// You can use a pilcrow (¶) as a line break and a tilde(~) as a non-breaking space:
const map = eurostatmap
    .map('choropleth')
    .title('stamp test')
    .stamp({
        x: 230,
        y: 100,
        size: 60,
        text: 'Hello~world¶New~Line¶Another~Line',
        stampColor: '#3792B6',
        textColor: '#3792B6',
        strokeWidth: 2,
    })
    .build()
Footnotes
Specify the text to be shown at the bottom of the map.
| Method | Type | Default value | Description |
|---|---|---|---|
| map.footnote([value]) | String | Some default text | The text. Note that the default value is mandatory. |
| map .footnoteTooltipText([value]) | String | The default disclaimer message. | Set a text to be shown in a tooltip when passing over the footnote. Set to null if no tooltip has to be shown. |
| map .showSourceLink([value]) | Boolean | true | Shows a link to the source dataset in the bottom right corner. (uses eurostatdatasetcode specified when using the stat() function). |
Map legend
Specify the style of the map legend with map.legend({parameters}).
Example:
map = eurostatmap.map(...)
	.legend({
		title: "Legend (%)",
		x: 10, y: 120,
		boxOpacity: 1,
        boxPadding: 10
	});
| Parameter | Type | Default value | Description |
|---|---|---|---|
| svgId | String | auto | The SVG element where to draw the legend. If not specified, an element is automatically built within the map. |
| title | Text | "” | The legend title. |
| position | String | auto | Corner-based auto-placement. Supported values: top right, top left, bottom right, bottom left. When set for top corners and header(false) is used, the legend moves down only if it would overlap title/subtitle text. |
| x | number | auto | The legend element X position, in case it is embeded within the map. If not specified, an automatic value is computed. |
| y | number | auto | The legend element Y position, in case it is embeded within the map. If not specified, an automatic value is computed. |
| boxOpacity | number | 0.7 | The legend box opacity, from 0 to 1. Sets opacity of em-legend-background |
| boxPadding | number | 0.7 | The legend box padding. Sets padding of em-legend-background |
For legends of specific map types please refer to their own sections:
- Choropleth legends
- Bivariate choropleth legends
- Proportional symbol legends
- Pie chart legends
- Categorical legends
Choropleth legends
In addition to the default legend parameters, choropleth maps have the following specific legend parameters:
| Parameter | Type | Default value | Description |
|---|---|---|---|
| ascending | String | true | The legend cells order. Set to false to invert. |
| shapeWidth | Number | 25 | The cell width. |
| shapeHeight | Number | 20 | The cell height. |
| sepLineLength | Number | 25 (defaults to shapeWidth) | The separation line length. |
| decimals | String | 0 | The number of decimal places for the legend labels. |
| labelType | ‘ranges’ or ‘thresholds’ | thresholds | The type of legend labels to be generated. |
| labelOffsets | Object | {x:3,y:0} | The distance between the legend box elements to the corresponding text label. |
| labelFormatter | Function | d3.format(“.” + decimals + “f”) | A function used to format the values of the legend labels. |
| labels | String[] | null | Manually define the labels to be used in the legend as an array. |
| noData | Boolean | true | Show ‘no data’ style. |
| noDataText | String | “No data” | ‘No data’ text label. |
| histogram | Object | undefined | When specified, the legend is shown as a histogram using these settings. See example below. |
| orientation | String | ‘vertical’ | Continuous color legend orientation. |
| maxMin | Boolean | false | When labelType is set to ‘thresholds’, show a tick for max and min values.values. |
| maxMinTickLength | Boolean | this.sepLineLength | Tick length for max and min values. |
| maxMinRegionLabels | Array | false | Show the corresponding region names to the max/min values.values. |
| maxMinLabels | Array | [’’,’‘] | Custom labels to show next to max min values.values. |
| ticks | Array | 0 | Number of tick marks on continuous color legend (set to 0 to disable and just show low/high labels). |
| tickValues | Array | undefined | Values to show next to the ticks. |
| tickLabels | Array | undefined | Labels to show next to the ticks. |
| lowLabel | String | ‘Low’ | Label for ‘low’. |
| highLabel | String | ‘High’ | Label for ‘high’. |
| pointOfDivergence | Number | undefined | The point at which your diverging colour scheme diverges. |
| pointOfDivergenceLabel | String | undefined | The label to show at the point of divergence (e.g. ‘policy target’). To show two arrows pointing in opposite directions with labels, use the pipe symbol like so: ‘Increase | Decrease’. |
| divergingLineLength | Number | undefined | Manually override the length of the divergence line. |
| divergingArrowLength | Number | undefined | Manually override the length of the divergence arrows (when using the pipe symbol in your pointOfDivergenceLabel). |
| pointOfDivergencePadding | Number | 7 | The amount of padding in pixels between the line of divergence and the other legend elements. |
| showDivergingLine | Boolean | true | Set to false to hide the horizontal divergence line/tick and show only the up/down arrows (when pointOfDivergenceLabel has 2 parts separated by \|). |
| divergingLinePadding | Number | 15 | Extra gap in pixels added after the longest legend label when computing the diverging line’s length, if divergingLineLength isn’t explicitly set. |
| pointOfDivergenceLabelsAtExtremes | Boolean | false | Position the 2 diverging labels near the top/bottom of the whole scale instead of near the divergence point. Unless divergingArrowLength is explicitly set, the arrows stretch to reach near their own label. |
| pointOfDivergenceLabelsStacked | Boolean | false | Position the 2 diverging labels above/below their arrowhead (starting at the arrow’s x position) instead of beside it, to save horizontal width. |
For histogram legends you can use the following settings:
.legend({
    title: 'histogram',
    x: 580,
    labelType: 'ranges',
    histogram: {
        height: 150,
        width: 200,
        orientation: 'horizontal',
        showCounts: false,
        showPercentages: true,
        labelRotation: 70,
        margin: { top: 0, right: 0, bottom: 0, left: 0 },
    },
})
Bivariate choropleth legends
In addition to the default legend parameters, bivariate choropleth maps have the following specific legend parameters:
| Parameter | Type | Default value | Description |
|---|---|---|---|
| squareSize | number | 80 | The size, in pixel, of the legend square. |
| rotation | number | 0 | The rotation to apply to the main legend. Recommended values are either 0 or -45 |
| label1 | string | “Variable 1” | X-axis title. Supports explicit line breaks using \\n or <br>. |
| label2 | string | “Variable 2” | Y-axis title. Supports explicit line breaks using \\n or <br>. |
| breaks1 | string[] | undefined | An array of strings shown as axis labels for variable 1 |
| breaks2 | string[] | undefined | An array of strings shown as axis labels for variable 2 |
| labelFontSize | int | 12 | The font size of the legend label. |
| noData | boolean | true | Show/hide ‘no data’ style in the legend. |
| noDataShapeHeight | number | 20 | The height, in pixel, of the ‘No data’ legend shape. |
| noDataShapeWidth | number | 25 | The width, in pixel, of the ‘No data’ legend shape. |
| noDataText | Text | “No data” | ‘No data’ text label. |
| noDataYOffset | number | 15 (45 at rotation -45) | Add distance between the main legend and the ‘no data’ item in pixels |
| yAxisLabelsOffset | Object | { x: 0, y: 0 } | Offset the axis labels that correspond with breaks1 |
| xAxisLabelsOffset | Object | { x: 0, y: 0 } | Offset the axis labels that correspond with breaks2 |
| yAxisTitleOffset | Object | { x: 0, y: 0 } | Offset the axis titles |
| xAxisTitleOffset | Object | { x: 0, y: 0 } | Offset the axis titles |
| axisArrows | boolean or Object | true | Show both axis arrows, or select axes with { x: boolean, y: boolean }. |
| axisArrowsBidirectional | boolean or Object | false | Draw arrowheads at both ends of the axis arrows, for both axes or select axes with { x: boolean, y: boolean }. |
| arrowHeight | number | 5 | Height of axis arrows |
| arrowWidth | number | 5 | Width of axis arrows |
| arrowPadding | number | 12 | Padding between arrow and axis label |
| showAxisExtremes | boolean or Object | true | Show low/high labels on both axes, or select axes with { x: boolean, y: boolean }. |
| axisExtremes | Object | { x: { low: “Low”, high: “High” }, y: { low: “Low”, high: “High” } } | Labels shown at low/high ends of x and y axes. |
| annotations | Object | undefined | Optional corner annotation text: topLeft, topRight, bottomLeft, bottomRight. Supports line breaks with <br>/<br/> or a newline. |
| annotationLineLength | number or Object | 18 | Length of corner annotation callout lines (pixels). Use a number for all corners or an object with topLeft, topRight, bottomLeft, bottomRight. |
| annotationOffsets | Object | auto | Annotation label offsets. Use { x, y } for all corners or per-corner objects: topLeft, topRight, bottomLeft, bottomRight, each with { x, y }. |
| annotationLineEndOffset | Object | { x: 0, y: 0 } | Extra offset applied to where each leader line meets its annotation label. Supports global { x, y } or per-corner { topLeft, topRight, bottomLeft, bottomRight } with { x, y }. |
Proportional symbol legends
In addition to the default legend parameters, proportional symbol maps have the following specific legend parameters: As proportional symbol maps allow for two visual variables (size and colour), a legend configuration object can be specified for each variable (sizeLegend and colorLegend).
| Parameter | Type | Default value | Description |
|---|---|---|---|
| map.ascending | Boolean | false | The order of the legend elements. Set to true to invert. |
| map.legendSpacing | Number | 35 | Spacing between the color & size legends (if applicable) |
| map.labelFontSize | Number | 12 | The font size of the legend labels |
| map.sizeLegend | Object | see below | The configuration object of the legend which illustrates the values of different symbol sizes |
| map.colorLegend | Object | see below | The configuration object of the legend which illustrates the values of different symbol colours |
sizeLegend
The following parameters are properties of the sizeLegend object:
| Parameter | Type | Default value | Description |
|---|---|---|---|
| title | String | null | Title of the size legend |
| titlePadding | Number | 15 | Padding between the legend title and legend body |
| values | Number | undefined | Manually set the raw data values to be used in the legend |
| cellNb | Number | 3 | Number of symbols to be shown in the legend (when values are not set manually) |
| shapePadding | Number | 15 | The padding between consecutive legend shape elements |
| shapeOffsets | Object | {x:0, y:0} | The offset applied to the shape elements in the legend. Applicable for use with psCustomSVG() |
| shapeFill | String | white | The colour of the symbols in the size legend. If unspecified, the colour of psFill() is used. |
| labelOffsets | Object | {x:10, y:0} | The distance between the legend box elements to the corresponding text label. |
| decimals | Number | 0 | The number of decimals for each label. |
| labelFormatter | Function | d3.format(“.” + decimals + “f”) | A function used to format the values of the legend labels. |
| noData | Boolean | false | Show a ‘no data’ legend item in the size legend. |
| noDataText | String | ‘No data’ | Text shown in the ‘no data’ legend item in the size legend. |
colorLegend
The following parameters are properties of the colorLegend object:
| Parameter | Type | Default value | Description |
|---|---|---|---|
| title | String | null | Title of the size legend |
| titlePadding | Number | 10 | Padding between the legend title and legend body |
| marginTop | Number | 30 | Margin top in pixels. Distance between size and color legends |
| shapeWidth | Number | 25 (base shapeWidth) | The width of the legend box elements |
| shapeHeight | Number | 20 (base shapeHeight) | The height of the legend box elements |
| shapePadding | Number | 1 | The padding between consecutive legend shape elements |
| labelOffsets | Object | {x:3,y:0} | The distance between the legend box elements to the corresponding text label. |
| decimals | Number | 0 | The number of decimals for each label. |
| labelFormatter | Function | d3.format(“.” + decimals + “f”) | A function used to format the values of the legend labels. |
| labels | Array | undefined | Specify your own legend labels as an array of strings. |
| noData | Boolean | true | Show a legend element that represents “no data” values. |
| noDataText | String | No data | No data element label text. |
| sepLineLength | Number | 25 (base shapeWidth) | The length of the separation line between classes. |
| sepLineStroke | Number | black | The colour of the separation line between classes. |
| sepLineStrokeWidth | Number | 1 | The width of the separation line between classes. |
| maxMin | Boolean | false | When labelType is ‘thresholds’, show a hoverable tick for the max/min values - hovering highlights the matching symbol on the map. |
| pointOfDivergence | Number | undefined | For a diverging classificationMethod (e.g. on multivariate/bivariate proportional-symbol maps), the class index at which your diverging colour scheme diverges. |
| pointOfDivergenceLabel | String | undefined | The label to show at the point of divergence. Use the pipe symbol for two arrows pointing in opposite directions, e.g. 'Increase \| Decrease'. |
| divergingLineLength | Number | undefined | Manually override the length of the divergence line. |
| divergingArrowLength | Number | undefined | Manually override the length of the divergence arrows (when using the pipe symbol in pointOfDivergenceLabel). |
| pointOfDivergencePadding | Number | 7 | Padding in pixels between the line of divergence and the other legend elements. |
| showDivergingLine | Boolean | true | Set to false to hide the horizontal divergence line/tick and show only the up/down arrows. |
| divergingLinePadding | Number | 15 | Extra gap in pixels added after the longest legend label when computing the diverging line’s length, if divergingLineLength isn’t explicitly set. |
| pointOfDivergenceLabelsAtExtremes | Boolean | false | Position the 2 diverging labels near the top/bottom of the whole scale instead of near the divergence point. Unless divergingArrowLength is explicitly set, the arrows stretch to reach near their own label. |
| pointOfDivergenceLabelsStacked | Boolean | false | Position the 2 diverging labels above/below their arrowhead instead of beside it, to save horizontal width. |
Pie chart legends
| Method | Type | Default value | Description |
|---|---|---|---|
| map.labelFontSize([value]) | int | 12 | Font size of the legend label. |
| map.legendSpacing | Number | 35 | Spacing between the color & size legends (if applicable). |
| map.sizeLegend | Object | see below | The configuration object of the legend which illustrates the values of different pie sizes. |
| map.colorLegend | Object | see below | The configuration object of the legend which illustrates the values of different pie colours. |
sizeLegend
The following parameters are properties of the sizeLegend object:
| Parameter | Type | Default value | Description |
|---|---|---|---|
| title | String | null | Title of the size legend. |
| titlePadding | Number | 10 | Padding between the legend title and legend body. |
| values | Array | auto (max and min radius) | The values used to size the pie charts in the legend. If unspecified, the highest and lowest values shown on the map are used. |
colorLegend
The following parameters are properties of the colorLegend object:
| Parameter | Type | Default value | Description |
|---|---|---|---|
| title | String | null | Title of the size legend. |
| titlePadding | Number | 10 | Padding between the legend title and legend body. |
| shapeWidth([value]) | number | 13 | Width of the legend box elements. |
| shapeHeight([value]) | number | 15 | Height of the legend box elements. |
| shapePadding([value]) | number | 5 | Distance between consecutive legend box elements. |
| labelOffsets | Object | {x:3,y:0} | Distance between the legend box elements to the corresponding text label. |
| noData([value]) | boolean | true | Show/hide ‘no data’ legend box element. |
| noDataText([value]) | string | “No data” | ‘No data’ label text. |
Categorical legends
| Parameter | Type | Default value | Description |
|---|---|---|---|
| shapeWidth | int | 25 | The cell width. |
| shapeHeight | int | 20 | The cell height. |
| shapePadding | number | 5 | The distance between consecutive legend elements |
| labelFontSize | int | 14 | The label font size (from the .em-legend-label CSS class). |
| labelOffsets | Object | {x:5,y:5} | The distance between the legend box elements to the corresponding text label. |
| noData | boolean | true | Show ‘no data’ style. |
| noDataText | Text | “No data” | ‘No data’ text label. |
| order | array | “undefined” | The order in which the legend classes should be drawn. E.g. [‘urb’,’int’,’rur’]. If left undefined, eurostatmap will order the classes automatically. |
Scalebar
Scalebar is configured via map.scalebar({...}).
| Property | Type | Default value | Description |
|---|---|---|---|
| show | boolean | false | Show/hide scalebar. |
| position | [number,number] | auto | Scalebar anchor position in SVG pixels. |
| units | string | ” km” | Unit suffix displayed on the scalebar labels. |
| textOffset | [number,number] | [4,8] | Label offset from tick position. |
| maxWidth | number | auto | Maximum scalebar width in pixels. |
| height | number | auto | Total height reserved for the scalebar group. |
| strokeWidth | number | auto | Stroke width used by scalebar lines. |
| segmentHeight | number | auto | Height of the horizontal middle segment line. |
| tickHeight | number | auto | Height of vertical tick marks. |
Legacy setters such as showScalebar, scalebarPosition, scalebarUnits, scalebarTextOffset and scalebarMaxWidth are deprecated.
Tooltip
The tooltip is the little rectangle showing information on the map feature under the mouse/finger pointer.
You can configure the style and content of the tooltip.
Example:
map = eurostatmap.map(...)
	.tooltip({
        id: 'em-tooltip', // id to give the tooltip element
        containerId: 'map-container', // eurostat-map ensures that the tooltip doesnt leave the bounds of this container
		transitionDuration: 200,
		xOffset: 30,
		yOffset: 20,
		textFunction: ((region, map) => { return feature.properties.na;  })
		showFlags: false
	});
use .em-tooltip for styling the tooltip container.
| Property | Type | Default value | Description |
|---|---|---|---|
| id | String | `em-tooltip-${containerId}` |
ID to give the tooltip DOM element. |
| containerId | String | map.svgId (default 'map') |
The ID of the tooltip’s “prison” element. Eurostat-map will ensure that the tooltip does not leave the bounds of this element. |
| transitionDuration | Number | 0 (managed internally) | The transition time (in ms) applied to the tooltip. |
| xOffset | Number | 30 | The x offset between the tooltip and the cursor. Superseded by offset.x when set. |
| yOffset | Number | 20 | The y offset between the tooltip and the cursor. Superseded by offset.y when set. |
| offset | Object | { x: xOffset ?? 30, y: yOffset ?? 20 } | Pixel offset {x, y} of the tooltip from the pointer. |
| opacity | Number | 1 | Opacity of the tooltip when shown. |
| textFunction | Function | see example above | A function returning the HTML to show in a tooltip, triggered when hovering over map features. The signature is function(rg, map) where rg is the selected region and map is the map. Set to null if no tooltip is needed. |
| decimals | Number | auto (max precision in dataset) | Fixed decimal places for the tooltip’s displayed value, preserving trailing zeros (choropleth maps). |
| showFlags | String | false | Set to null, 0, or false if no flag should be shown in the tooltip. Use “short” to show a single letter or “long” to show the full flag text. |
| omitRegions | Array | [] | If specified, the tooltip will not show for these regions. For example: [‘RU’, ‘BY’, ‘IL’, ‘PS’] |
Styling
Specify specific map styles. As of V4, styles have been moved to CSS classes. See css.md for a list of CSS rules. See deprecated.js for deprecated style functions and their successors. (or check the developer console for warnings when using deprecated functions)
| Method | Type | Default value | Description |
|---|---|---|---|
| map.hoverColor([value]) | String | “red” | The fill style of the selected NUTS regions. |
| map.drawCoastalMargin([value]) | boolean | false | Set to true to show a coastal blurry margin. False otherwise. |
| map.coastalMarginSettings([value]) | object | { standardDeviation: 0.8, x: ‘-50%’, y: ‘-50%’, width: ‘150%’, height: ‘150%’, strokeWidth: 0.6, color: ‘rgb(0, 0, 0)’, opacity: 0.1 } | The settings for the coastal margin. |
| _map_.drawGraticule([value]) | boolean | false | Set to true to show the graticule (meridian and parallel lines). False otherwise. Calls to this method after the map is built will update the graticule. |
Insets
To add map insets, use the map.insets([values]) method.
For default map insets showing European overseas territories and small countries, use:
eurostatmap.map(...)
	.insets("default");
map.insets(true) is equivalent to map.insets("default").
To specify more precisely which insets to show, their geographical extent, scale, position, etc., specify the list of insets such as:
eurostatmap.map(...)
	.insets(
		{ geo:"MQ", scale:"01M", position: { z: 1000 }, title:"Martinique", width:200, height:90, x:0, y:0 },
		{ geo:"GF", scale:"03M", position: { z: 9000 }, title:"French Guyana", width:200, height:90, x:210, y:0 }
	)
	.insetBoxPosition([335,345]);
See also this example with a focus on Spain (see the code).
Note that a map inset is built as a proper map within a map: It has all properties of a map, and share most of them with its parent map. It is thus possible to define map insets within map insets, following a recursive structure.
| Method | Type | Default value | Description |
|---|---|---|---|
| map.insets([values]) | List | [] | The list of insets. Each map inset is described as an object with the map inset attributes. |
| map.insetBoxPosition([value]) | number | auto | The position of the insets box element within the map. |
| map.insetBoxPadding([value]) | number | 5 | When several insets are specified within the map, the distance between the different insets. |
| map.insetBoxWidth([value]) | number | 210 | The default width of the insets box, which are squared by default. |
| map.insetZoomExtent([value]) | Array | null | The zoom extent of inset maps. The first value within [0,1] defines the maximum zoom out factor - the second value within [1,infinity] defines the maximum zoom in factor. Set to [1,1] to forbid zooming and allow panning. Set to null to forbid both. |
| map.insetScale([value]) | String | “03M” | The default scale of the insets. |
Minimap
You can add minimaps to your map like so:
map.minimap({
    x: 705,
    y: 90,
    z: 200, // orthographic projection scale (globe zoom level)
    color: '#929292ff', // outer ring / highlight color
    highlightIds: ['DE'], // highlight one or more countries by id
    size: 160, // diameter in pixels
    debounce: 3, // debounce time in ms for zoom/pan updates
})
Buttons
You can add zoom buttons with map.zoomButtons(true) and an inset toggle with map.insetsButton(true). If insetsButton(true) is set and no insets were configured, eurostat-map automatically applies map.insets('default'). See ui.css for their styling.
Export
Export the map as a PNG image or a SVG file.
| Method | Type | Default value | Description |
|---|---|---|---|
| map.exportMapToPNG() | this | Export the map as a PNG image. | |
| map.exportMapToSVG() | this | Export the map as a SVG image. |
Miscellaneous
| Method | Type | Default value | Description |
|---|---|---|---|
| map.noDataText([value]) | String | “Data unavailable” | The text to show for regions where no data is available. |
| map.language([value]) | String | “en” | The language code, for multilingual maps. |
| map.transitionDuration([value]) | int | 500 | When updating statistical figures, the map style changes progressively. This parameter sets the duration of this transition, in ms. |
| map.filtersDefinitionFunction([value]) | Function | function() {} | A function defining SVG filter elements. To be used to defined fill patterns. |
| map.onBuild([value]) | Function | undefined | A function to execute after the map build is complete. |
| map.getTime() | String | - | Return the time parameter of the statistical data. When a filter such as { lastTimePeriod : 1 } is used, this method allows a retrieval of the map timestamp. |
| map.setFromURL() | this | - | Set some map parameters based on URL parameters: “w” for width, “h” for height, “x” for xGeoCenter, “y” for yGeoCenter, “z” for pixGeoSize, “s” for scale, “lvl” for nuts level, “time” for time, “proj” for the CRS, “geo” for the geographical territory, “ny” for the NUTS version, “language” for the language, “numberOfClasses” for the number of classes. |
Build and update
After changing some parameters, one of the following methods need to be executed:
| Method | Type | Default value | Description |
|---|---|---|---|
| map.build() | this | Build (or rebuild) the entire map. | |
| map.updateGeoData() | this | Get new geometrical data. It should be used to update the map when parameters on the map geometries have changed. | |
| map.updateStatData() | this | Get new statistical data. It should be used to update the map when parameters on the statistical data sources have changed. | |
| map.updateStatValues() | this | Update client side information related to statistical values. It should be used to update the map when statistical values have changed. | |
| map.updateClassification() | this | Update the map when parameters on the classification have changed. | |
| map.updateStyle() | this | Update the map when parameters on the styling have changed. | |
| map.recalculateLayout() | void | Recalculate map/header/footer layout after structural changes. |
Anything unclear or missing? Feel free to ask !
Version migration
See https://github.com/eurostat/eurostat-map/blob/master/docs/release-notes.md for any major changes.
Encoding API migration notes
The library is migrating toward a clearer split between dataset definition and visual mapping:
- Define datasets with
stat(name, config). - Connect datasets to channels with
encoding(channel, config).
Recommended pattern:
map
    .stat('population', { ... })
    .stat('growthRate', { ... })
    .encoding('size', { stat: 'population' })
    .encoding('color', { stat: 'growthRate' })
Composition maps follow the same model:
map
    .stat('composition', {
        categoryParameter: 'age',
        categoryCodes: ['Y_LT15', 'Y15-64', 'Y_GE65'],
        ...
    })
    .encoding('composition', { stat: 'composition' })
Backward compatibility remains in place for existing code:
- Channel-named stats such as
.stat('size', ...)and.stat('color', ...). - Legacy composition helpers (
statPie,statWaffle,statBar,statStripe). - Legacy positional composition signatures (for example
.stat('composition', config, categoryParameter, categoryCodes, ...)).