eurostat-map.js
eurostat-map.js API reference
Map
Creation - Definition - Geography
Statistical data
Eurostat - CSV - Custom JS
Map types
Choropleth map - Proportional symbol map - Proportional pie chart map - Categorical map - Bivariate choropleth map - Stripe composition map - Sparkline map
Map elements and methods
Title - Frame - Legend - Scalebar - Tooltip - Styling - Insets - Bottom text & link to source data - Export - Miscellaneous - Build & update
Anything unclear or missing? Feel free to ask !
Map creation
Create a map with let map = eurostatmap.map( mapType ). Set the parameter mapType to a value corresponding with the desired map type:
"ch"for a choropleth map,"ps"for a proportional symbol map,"pie"for a proportional pie chart map,"ct"for a categorical map."chbi"for a bivariate choropleth map."scomp"for a stripe composition map."spark"for a spark line map.
The map can then be customised with the methods listed in the tables below. Most of the map methods follow the pattern map.myMethod([value]): If a value is specified, the method sets the parameter value and returns the map object itself. If no value is specified, the method returns the current value of the parameter.
It is also possible to specify the map parameters as an object: let map = eurostatmap.map( mapType, { param1: v1, param2: v2} );. This is equivalent to: let map = eurostatmap.map( mapType ).param1(v1).param2(v2);
Map definition
Specify the map SVG element.
| Method | Type | Default value | Description |
|---|---|---|---|
| map.svgId([value]) | String | “map” | The id of the SVG element of the HTML page where to draw the map. |
| map.width([value]) | int | 800 | The width of the map, in pixel. |
| map.height([value]) | int | auto | The height of the map, in pixel. If not specified, the height is set automatically as 85% of the width. |
Map geography
Specify the NUTS geometries and the geographical extent of the map.
| Method | Type | Default value | Description |
|---|---|---|---|
| map.nutsLvl([value]) | int/string | 3 | The nuts level to show on the map, from 0 (national level) to 3 (more local level). Note that not all NUTS levels are always available for Eurostat databases. When using custom data sources and mixing different NUTS levels, set this option to “mixed” to show the different levels at once. |
| map.nutsYear([value]) | int | 2016 | The version of the NUTS dataset to use. Possible values are given in Nuts2json. Note that the default value will be adjusted in the future depending on the NUTS legislation in force. |
| map.bordersToShow([value]) | Array | [“eu”,”efta”,”cc”,”oth”,”co”] | The types of boundaries to show on the map. See Nuts2json for possible types. |
| map.countriesToShow([value]) | Array | [“AL”,”AT”,”BE”,”BG”,”CH”,”CY”,”CZ”,”DE”,”DK”,”EE”,”EL”,”ES”, “FI”,”FR”,”HR”,”HU”,”IE”,”IS”,”IT”,”LI”,”LT”, “LU”,”LV”,”ME”,”MK”, “MT”,”NL”,”NO”,”PL”,”PT”,”RO”,”RS”,”SE”,”SI”,”SK”,”TR”,”UK”] | The country codes of the countries to be shown on the map. Countries not included in the array, but included in NUTS2JSON will be coloured using map.nutsrgFillStyle instead of data-driven colour. (Currently for choropleth maps only). |
| map.geo([value]) | String | “EUR” | The map geographical territory, by default the entire European territory “EUR”. For world maps use “WORLD” and set proj to 54030. Note that world templates are currently only available for choropleth maps. Other possible values are given in Nuts2json. |
| map.proj([value]) | String | “3035” | The map projection EPSG code. For world maps: use 54030. Possible values are given in Nuts2json. Note that these values depend on the geographical territory. |
| map.scale([value]) | String | “20M” | The simplification level of the map, among “03M”, “10M”, “20M”, “60M” (for Europe). The most simplified version is “60M”. The level “01M” is also available for some geographical territories: For more information on possible values by geographical territory, see Nuts2json. |
| map.geoCenter([value]) | Array ([x,y]) | auto | The geographical coordinates of the position where to center the map view. These coordinates are expected to be expressed in the map projection. If not specified, a position is computed automatically. |
| map.pixSize([value]) | number | auto | The zoom level of the map view. This is expressed as the size of a pixel in geographical unit (or the map resolution). If not specified, a value is computed automatically to show the map extent. |
| map.zoomExtent([value]) | Array | undefined | The zoom extent. The first value within [0,1] defines the maximum zoom out factor - the second value within [1,infinity] defines the maximum zoom in factor. Set to [1,1] to forbid zooming and allow panning. Set to null to forbid both. |
World maps
It is also possible to build thematic world maps using eurostat-map. Simply pass “WORLD” to the map.geo() method. See this example for how to configure a world map.
| Method | Type | Default value | Description |
|---|---|---|---|
| map.worldFillStyle([value]) | string | ‘#E6E6E6’ | The default fill colour for territories on a world map |
| map.worldStroke([value]) | string | ‘black’ | The default stroke colour of the borders for states on a world map. |
| map.worldStrokeWidth([value]) | number | 1 | The default stroke width of the borders of states on a world map. |
| map.worldCoastStroke([value]) | string | ‘none’ | The default stroke colour of the coastal borders of states on a world map. |
| map.worldCoastStrokeWidth([value]) | number | 0.3 | The default stroke width of the coastal borders of states on a world map. |
| map.projectionFunction([value]) | d3 projection | d3.geoRobninson() | Here you can define your own custom projection function for world maps |
Statistical data
The map statistical data can be accessed with the map.statData() method, which returns an object with the following methods:
| Method | Description | ||
|---|---|---|---|
| get([nutsId]) | Return the stat value {value,status} from a nuts id. If no argument is specified, returns the entire index. | ||
| getValue([nutsId]) | Return the stat value from a nuts id. | ||
| set([nutsId,stat]) | Set a stat value from a nuts id. The new statistical data format can be either {value:34.324,status:”e”} or a the value only. | ||
| setData([index]) | Set statistical data, already indexed by nutsId. The index has a structure like: { “PT”:0.2, “LU”:0.6, …}, or with status: { “PT”: {value:0.2, status:”e”}, “LU”:0.6, …} | ||
| getArray() | Return all stat values as an array. This can be used to classify the values. | ||
| getUniqueValues() | Return stat unique values. This can be used for categorical maps. | ||
| getMin() | Get minimum value. | ||
| getMax() | Get maximum value. | ||
| unitText([value]) | String | undefined | The text of the unit of measurement, to show in the tooltip. |
The map statistical data source can be accessed with the map.stat([value]) method. Several types of data sources are supported (see sections below).
Eurostat database
Specify statistical data to be retrieved on-the-fly from Eurostat database. The query parameters can be retrieved from this page.
Example:
map = eurostatmap.map(...);
map.stat( {
	eurostatDatasetCode: "lfst_r_lfu3rt",
	filters:{
		age: "Y20-64",
		sex: "T",
		unit: "PC",
		time: "2019"
	}
});
| Parameter | Type | Default value | Description |
|---|---|---|---|
| eurostatDatasetCode | String | “demo_r_d3dens” | The Eurostat database code of the statistical variable. See here to find them. |
| filters | Object | { lastTimePeriod : 1 } | The Eurostat dimension codes to filter/select the chosen statistical variable. See here or here to find them. |
| precision | int | 2 | The precision of the statistical variable to retrieve (number of decimal places). |
CSV
Specify statistical data to be retrieved from CSV data.
Example:
map = eurostatmap.map(...);
map.stat( {
	csvURL: "https://raw.githubusercontent.com/eurostat/eurostat-map.js/master/examples/urb_rur_typo.csv",
	geoCol: "NUTS_ID_2013",
	valueCol: "urban_rural"
});
| Parameter | Type | Default value | Description |
|---|---|---|---|
| csvURL | String | undefined | The CSV file URL. |
| geoCol | String | “geo” | The column with the NUTS ids. |
| valueCol | String | “value” | The column with the statistical values. |
Custom JS
Specify statistical data region by region, from JavaScript code, or any kind of JSON data source.
Example:
map = eurostatmap.map(...);

//specify values region by region
map.statData().set("LU",500).set("DE",400).set("FR",100).set("IT",600)

//or in one time. Note that the 'status' can be specified but is not mandatory.
map.statData().setData({
	"FR": 10,
	"DE": {value:7,status:"e"},
	"UK": 12,
})
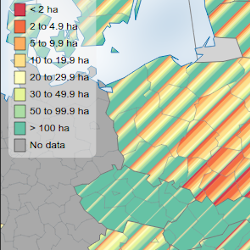
Choropleth map
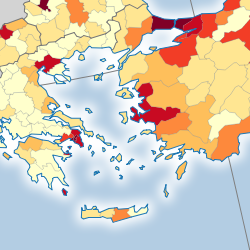
A choropleth map shows areas colored or patterned in proportion to a statistical variable. These maps should be used to show intensive statistical variables such as proportions, ratios, densities, rates of change, percentages, etc.
Here is an example with color value (see the code), another with a diverging color scheme (see the code), and a last one with a texture pattern (see the code).
Example:
eurostatmap
    .map('ch')
    .title('Population in Europe')
    .stat({ eurostatDatasetCode: 'demo_r_d3dens', unitText: 'inhab./km²' })
    .classifMethod('threshold')
    .threshold([50, 75, 100, 150, 300, 850])
    .tooltipShowFlags(false)
    .legend({ noData: false, labelDecNb: 0, x: 15, y: 160 })
    .build()
| Method | Type | Default value | Description |
|---|---|---|---|
| map.clnb([value]) | int | 7 | The number of classes. When classifMethod = “threshold”, this parameter is inferred from the number of breaks specified. |
| map.classifMethod([value]) | String | “quantile” | The classification method. Possible values are “quantile”, “equinter” for equal intervals, and “threshold” for user defined threshol (see threshold method). |
| map.colors([value]) | Array | null | The colours to use for the classes. if unspecified, default colorFun is used. |
| map.threshold([value]) | Array | [0] | If classifMethod = “threshold”, the breaks of the classification. |
| map.makeClassifNice([value]) | boolean | true | Make nice break values. Works only for classifMethod = “equinter”. |
| map.colorFun([value]) | Function | d3.interpolateYlOrBr | The color function, as defined in d3-scale-chromatic |
| map.classToFillStyle([value]) | Function | See description | A function returning a fill style for each class number. The default values is the function returned by eurostatmap.getColorLegend(colorFun()). |
| map.noDataFillStyle([value]) | String | “lightgray” | The fill style to be used for regions where no data is available. |
In addition to the default legend parameters, choropleth maps have the following specific legend parameters:
| Parameter | Type | Default value | Description |
|---|---|---|---|
| ascending | String | true | The legend cells order. Set to false to invert. |
| shapeWidth | int | 15 | The cell width. |
| shapeHeight | int | 13 | The cell heigth. |
| sepLineLength | int | 17 | The separation line length. |
| sepLineStroke | int | “black” | The separation line color. |
| sepLineStrokeWidth | int | 1 | The separation line width. |
| labelFontSize | int | 13 | The label font size. |
| labelDecNb | String | ” - “ | The number of decimal for the legend labels. |
| labelOffset | int | 3 | The distance between the legend box elements to the corresponding text label. |
| labelFormatter | Function | d3.format(“.” + labelDecNb + “f”) | A function used to format the values of the legend labels. |
| noData | boolean | true | Show ‘no data’ style. |
| noDataText | Text | “No data” | ‘No data’ text label. |
| labels | [] | null | Manually define the labels to be used in the legend as an array |
Proportional symbol map
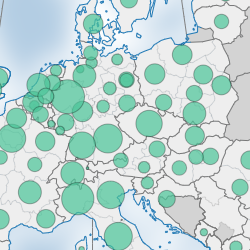
A proportional symbol map shows symbols (typically circles) sized in proportion to a statistical variable. These maps should be used to show statistical extensive variables such as quantities, populations, numbers, etc. Here is an example (see the code).
Example:
eurostatmap
    .map('ps')
    .nutsLvl(1)
    .stat({
        eurostatDatasetCode: 'demo_r_pjangrp3',
        filters: { age: 'TOTAL', sex: 'T', unit: 'NR', time: 2016 },
        unitText: 'inhabitants',
    })
    .psMaxSize(25)
    .psFill('red')
    .build()
Along with data-driven sizing, it is possible to colour the symbols according to a statistical variable as well. This is achieved by adding the “size” and “color” strings to their corresponding stat methods. For example:
    //GDP per inhabitant (colour of symbol)
    .stat("color", { eurostatDatasetCode: "nama_10r_3gdp", unitText: "EUR/inhabitant", filters: { unit: "EUR_HAB", time: "2018" } })
    // Total GDP (size of symbol)
    .stat("size", { eurostatDatasetCode: "nama_10r_3gdp", unitText: "Million EUR", filters: { unit: "MIO_EUR", time: "2018" } })
| Method | Type | Default value | Description |
|---|---|---|---|
| map.psShape([value]) | string | circle | The shape of the symbol. Accepted values: circle, bar, square, star, cross, diamond, triangle, wye or custom |
| map.psCustomShape([value]) | Object | null | A custom symbol to be used with d3.symbol when psShape is set to “custom”. See http://using-d3js.com/05_10_symbols.html#h_66iIQ5sJIT |
| map.psCustomSVG([value]) | Template Literal | null | Use this method for defining a custom SVG, which will be used as the proportional symbol. E.g. map.psCustomSVG(<svg width="100" height="100"><rect width="100" height="100" /></svg>). |
| map.psOffset([value]) | Object | {x:0,y:0} | Defines the offsets to apply to the symbols on the map. Only applicable to symbols where custom svgs are specified ( through psCustomSVG) |
| map.psMaxSize([value]) | number | 30 | The maximum size of the symbol. For shapes and vertical bars, this value is in pixels, but for psCustomSVG() it represents the scale factor of the transform applied to it. |
| map.psMinSize([value]) | number | 0.8 | The minimum size / scale of the symbol. |
| map.psBarWidth([value]) | number | 5 | Width in pixels of the vertical bars. Only to be used with a psShape of type “bar” |
| map.psFill([value]) | String | “#B45F04” | The fill color or pattern of the symbol, for when a colour scheme is not defined. |
| map.psFillOpacity([value]) | number | 0.7 | The opacity of the symbol, from 0 to 1. |
| map.psStroke([value]) | String | “#fff” | The stroke color of the symbol. |
| map.psStrokeWidth([value]) | number | 0.3 | The width of the stroke. |
| map.psClasses([value]) | number | 5 | The number of classes to use when applying data-driven colour for the symbols. Similar to clnb() for choropleth maps. |
| map.psColorFun([value]) | function | d3.interpolateOrRd | The color function, as defined in d3-scale-chromatic |
| map.psSizeFun([value]) | function | d3.scaleSqrt | The D3 scale function used to define the sizes of the symbols. The following methods are then called internally: psSizeFun().domain(sizeDomain).range([psMinSize, psMaxSize]) |
| map.psClassifMethod([value]) | String | “quantile” | The classification method. Possible values are “quantile”, “equinter” for equal intervals, and “threshold” for user defined threshold (see threshold method). |
| map.psThreshold([value]) | Array | [0] | If psClassifMethod = “threshold”, the breaks of the classification. |
| map.psColours([value]) | Array | null | The colours to be using data-driven colour. The number of colours specified in the array should match the number of classes (specified using psClasses()) |
| map.noDataFillStyle([value]) | String | “lightgray” | The fill style to be used for regions where no data is available. |
In addition to the default legend parameters, proportional symbol maps have the following specific legend parameters: As proportional symbol maps allow for two visual variables (size and colour), a legend configuration object can be specified for each variable (sizeLegend and colorLegend).
| Parameter | Type | Default value | Description |
|---|---|---|---|
| map.ascending | Boolean | false | The order of the legend elements. Set to true to invert. |
| map.legendSpacing | Number | 35 | Spacing between the color & size legends (if applicable) |
| map.labelFontSize | Number | 12 | The font size of the legend labels |
| map.sizeLegend | Object | see below | The configuration object of the legend which illustrates the values of different symbol sizes |
| map.colorLegend | Object | see below | The configuration object of the legend which illustrates the values of different symbol colours |
sizeLegend
The following parameters are properties of the sizeLegend object:
| Parameter | Type | Default value | Description |
|---|---|---|---|
| title | String | null | Title of the size legend |
| titlePadding | Number | 10 | Padding between the legend title and legend body |
| values | Number | undefined | Manually set the raw data values to be used in the legend |
| cellNb | Number | 4 | Number of symbols to be shown in the legend (when values are not set manually) |
| shapePadding | Number | 10 | The padding between consecutive legend shape elements |
| shapeOffset | Object | {x:0, y:0} | The offset applied to the shape elements in the legend. Applicable for use with psCustomSVG() |
| shapeFill | String | white | The colour of the symbols in the size legend. If unspecified, the colour of psFill() is used. |
| labelOffset | Number | 25 | The distance between the legend box elements to the corresponding text label. |
| labelDecNb | Number | 0 | The number of decimals for each label. |
| labelFormatter | Function | d3.format(“.” + labelDecNb + “f”) | A function used to format the values of the legend labels. |
colorLegend
The following parameters are properties of the colorLegend object:
| Parameter | Type | Default value | Description |
|---|---|---|---|
| title | String | null | Title of the size legend |
| titlePadding | Number | 10 | Padding between the legend title and legend body |
| shapeWidth | Number | 13 | The width of the legend box elements |
| shapeHeight | Number | 13 | The height of the legend box elements |
| shapePadding | Number | 10 | The padding between consecutive legend shape elements |
| shapePadding | Number | 10 | The padding between consecutive legend shape elements |
| labelOffset | Number | 25 | The distance between the legend box elements to the corresponding text label. |
| labelDecNb | Number | 0 | The number of decimals for each label. |
| labelFormatter | Function | d3.format(“.” + labelDecNb + “f”) | A function used to format the values of the legend labels. |
| noData | Boolean | true | Show a legend element that represents “no data” values. |
| noDataText | String | No data | No data element label text. |
| sepLineLength | Number | 17 | The length of the separation line between classes. |
| sepLineStroke | Number | black | The colour of the separation line between classes. |
| sepLineStrokeWidth | Number | 1 | The width of the separation line between classes. |
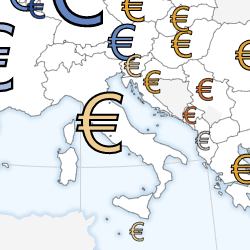
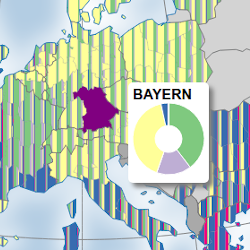
Proportional pie chart map
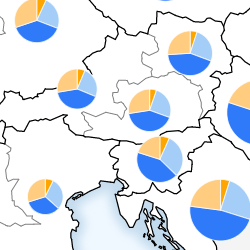
A proportional pie chart map shows pie charts sized in proportion to a statistical variable. The slices of the pie chart are made up of the different categories of that statistical variable. Here is an example (see the code).
Example:
//population composition by age
eurostatmap
    .map('pie')
    .nutsLvl(1)
    .stat('Y_LT15', {
        eurostatDatasetCode: 'demo_r_pjanaggr3',
        filters: { age: 'Y_LT15', sex: 'T', unit: 'NR', time: '2019' },
        unitText: 'people',
    })
    .stat('Y15-64', {
        eurostatDatasetCode: 'demo_r_pjanaggr3',
        filters: { age: 'Y15-64', sex: 'T', unit: 'NR', time: '2019' },
        unitText: 'people',
    })
    .stat('Y_GE65', {
        eurostatDatasetCode: 'demo_r_pjanaggr3',
        filters: { age: 'Y_GE65', sex: 'T', unit: 'NR', time: '2019' },
        unitText: 'people',
    })
    .catLabels({ Y_LT15: '< 15', 'Y15-64': '15 to 64', Y_GE65: '> 65' })
    .catColors({ Y_LT15: '#33a02c', 'Y15-64': '#cab2d6', Y_GE65: '#ff7f00' })
    .legend({ x: 550, y: 200, sizeLegend: { title: 'Total Population' }, colorLegend: { title: 'Population by Age' } })
Or simpler:
//population composition by age
eurostatmap
    .map('pie')
    .nutsLvl(3)
    .nutsYear(2016)
    .stripeWidth(10)
    .stripeOrientation(45)
    .statPie(
        { eurostatDatasetCode: 'demo_r_pjanaggr3', filters: { sex: 'T', unit: 'NR', time: '2019' }, unitText: 'people' },
        'age', //parameter that the categories belong to
        ['Y_LT15', 'Y15-64', 'Y_GE65'], //category codes
        ['< 15', '15 to 64', '> 65'], //labels
        ['#33a02c', '#cab2d6', '#ff7f00'] //colours
    )
    .legend({ x: 550, y: 200, sizeLegend: { title: 'Total Population' }, colorLegend: { title: 'Population by Age' } })
If the sum of the chosen categories do not represent the complete total for that variable, then an optional code can be included as the last parameter passed to the statPie() method. For example, when making a proportional pie chart map for different causes of death, the chosen categories “Respiratory”, “Cancer”, “Circulatory” do not represent all causes of death. In this case, the code for “all causes of death” is specified (“A-R_V-Y”). The shares of each categories are then calculated according to this total and not just the total of the specified categories. The remaining share is then given the label “other”, which can be changed using the pieOtherText() method and the colour of its pie slices can be changed using the pieOtherColor() method.
         .statPie(
            { eurostatDatasetCode: "hlth_cd_asdr2", filters: { sex: "T", time: "2016", age: "TOTAL", unit: "RT" }, unitText: "death rate per 100 000" },
            "icd10", //parameter that the categories belong to
            ["J", "C", "I"], //category codes
            ["Respiratory", "Cancer", "Circulatory"], //category labels
            ["orange", "#A4CDF8", "#2E7AF9", "blue"], //colours
            "A-R_V-Y" //code for the total (all causes of death)
          )
| Method | Type | Default value | Description |
|---|---|---|---|
| map.pieMaxRadius([value]) | Number | 15 | The maximum radius of the pie chart. |
| map.pieMinRadius([value]) | Number | 5 | The minimum radius of the pie chart. |
| map.catColors([value]) | object | auto | The colors of the slices, indexed by category code. If not specified, different colors are proposed. |
| map.catLabels([value]) | object | auto | The colors of the slices, indexed by category code. |
| map.showOnlyWhenComplete([value]) | boolean | false | Draw a region only when data is available for all categories. If one is missing, the region is considered as with ‘no data’. If not, the value of missing data is set to 0. |
| map.noDataFillStyle([value]) | string | “darkgray” | The fill style to be used for regions where no data is available. |
| map.pieChartInnerRadius([value]) | number | 0 | Inner radius of the pie charts. Increase this value to turn the pie charts into donut charts. |
| map.pieStrokeFill([value]) | string | white | The colour of the pie chart stroke. |
| map.pieStrokeWidth([value]) | number | 0.3 | The width of the pie chart stroke. |
| map.pieOtherText([value]) | string | Other | The colour of the “other” segments of the pie charts (only applicable when the total is calculated using a separate category code, specified in the statPie method) |
| map.pieOtherColor([value]) | string | “#FFCC80” | The colour of the “other” segments of the pie charts (only applicable when the total is calculated using a separate category code, specified in the statPie method) |
In addition to the default legend parameters, proportional pie chart maps have the following specific legend parameters:
| Method | Type | Default value | Description |
|---|---|---|---|
| map.labelFontSize([value]) | int | 12 | Font size of the legend label. |
| map.legendSpacing | Number | 35 | Spacing between the color & size legends (if applicable). |
| map.sizeLegend | Object | see below | The configuration object of the legend which illustrates the values of different pie sizes. |
| map.colorLegend | Object | see below | The configuration object of the legend which illustrates the values of different pie colours. |
sizeLegend
The following parameters are properties of the sizeLegend object:
| Parameter | Type | Default value | Description |
|---|---|---|---|
| title | String | null | Title of the size legend. |
| titlePadding | Number | 10 | Padding between the legend title and legend body. |
| values | Array | auto (max and min radius) | The values used to size the pie charts in the legend. If unspecified, the highest and lowest values shown on the map are used. |
colorLegend
The following parameters are properties of the colorLegend object:
| Parameter | Type | Default value | Description |
|---|---|---|---|
| title | String | null | Title of the size legend. |
| titlePadding | Number | 10 | Padding between the legend title and legend body. |
| shapeWidth([value]) | number | 13 | Width of the legend box elements. |
| shapeHeight([value]) | number | 15 | Height of the legend box elements. |
| shapePadding([value]) | number | 5 | Distance between consecutive legend box elements. |
| labelOffset([value]) | number | 5 | Distance between the legend box elements to the corresponding text label. |
| noData([value]) | boolean | true | Show/hide ‘no data’ legend box element. |
| noDataText([value]) | string | “No data” | ‘No data’ label text. |
Categorical map
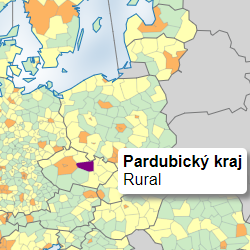
A categorical map shows areas according to categories (or discrete values). Here is an example of such map (see the code).
Example:
eurostatmap
    .map('ct')
    .nutsYear(2013)
    .nutsLvl(3)
    .stat({
        csvURL: 'https://raw.githubusercontent.com/eurostat/eurostat-map.js/dev/examples/urb_rur_typo.csv',
        geoCol: 'NUTS_ID_2013',
        valueCol: 'urban_rural',
    })
    .classToFillStyle({ urb: '#fdb462', int: '#ffffb3', rur: '#ccebc5' })
    .classToText({ urb: 'Urban', int: 'Intermediate', rur: 'Rural' })
    .legend({ x: 10, y: 170, order: ['urb', 'int', 'rur'] })
    .build()
| Method | Type | Default value | Description |
|---|---|---|---|
| map.classToFillStyle([value]) | Object | auto | An object giving the fill style depending on the class code. If not specify, use default colors. |
| map.classToText([value]) | Object | auto | An object giving the legend label text depending on the class code. If not specified, use the class code. |
| map.noDataFillStyle([value]) | String | “lightgray” | The fill style to be used for regions where no data is available. |
In addition to the default legend parameters, categorical maps have the following specific legend parameters:
| Parameter | Type | Default value | Description |
|---|---|---|---|
| shapeWidth | int | 15 | The cell width. |
| shapeHeight | int | 13 | The cell heigth. |
| shapePadding | number | 5 | The distance between consecutive legend elements |
| labelFontSize | int | 13 | The label font size. |
| labelOffset | int | 5 | The distance between the legend box elements to the corresponding text label. |
| noData | boolean | true | Show ‘no data’ style. |
| noDataText | Text | “No data” | ‘No data’ text label. |
| order | array | “undefined” | The order in which the legend classes should be drawn. E.g. [‘urb’,’int’,’rur’]. If left undefined, eurostatmap will order the classes automatically. |
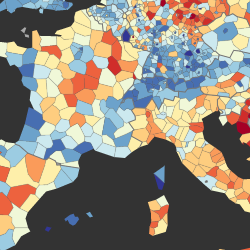
Bivariate choropleth map
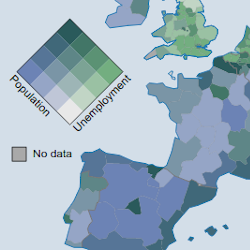
A bivariate choropleth map is a choropleth map showing the combination of two statistical variables. It shows how the correlation between these variables varies across space. Here is an example of such map (see the code).
Example:
eurostatmap
    .map('chbi')
    .nutsLvl(2)
    .nutsYear(2016)
    .stat('v1', { eurostatDatasetCode: 'demo_r_d3dens', unitText: 'inh./km²' })
    .stat('v2', {
        eurostatDatasetCode: 'lfst_r_lfu3rt',
        filters: { age: 'Y20-64', sex: 'T', unit: 'PC', time: 2017 },
        unitText: '%',
    })
    .clnb(4)
    .build()
| Method | Type | Default value | Description |
|---|---|---|---|
| map.clnb([value]) | int | 3 | The number of classes for the classification. The same value is used for both variables. |
| map.startColor([value]) | color | “#e8e8e8” | The color for lowest values of both variables. |
| map.color1([value]) | color | “#73ae80” | The color for the highest values of variable 1, and lowest of variable 2. |
| map.color2([value]) | color | “#6c83b5” | The color for the highest values of variable 2, and lowest of variable 1. |
| map.endColor([value]) | color | “#2a5a5b” | The color for highest values of both variables. |
| map.classifier1([value]) | Function | auto | A function which returns a class number from a stat value. This allows you to set the class thresholds manually. |
| map.classifier2([value]) | Function | auto | A function which returns a class number from a stat value. This allows you to set the class thresholds manually. |
| map.classToFillStyle([value]) | Function | auto | A function returning the colors for each pair of classes i,j. |
| map.noDataFillStyle([value]) | color | “lightgray” | The fill style to be used for regions where no data is available. |
In addition to the default legend parameters, bivariate choropleth maps have the following specific legend parameters:
| Parameter | Type | Default value | Description |
|---|---|---|---|
| squareSize | number | 50 | The size, in pixel, of the legend square. |
| rotation | number | 0 | The rotation to apply to the main legend. Recommended values are either 0 or -45 |
| label1 | string | “Variable 1” | The text for the label of variable 1. |
| label2 | string | “Variable 2” | The text for the label of variable 1. |
| labelFontSize | int | 12 | The font size of the legend label. |
| noData | boolean | true | Show/hide ‘no data’ style in the legend. |
| noDataShapeSize | number | 15 | The size, in pixel, of the ‘No data’ legend shape. |
| noDataText | Text | “No data” | ‘No data’ text label. |
| noDataYOffset | Text | 0 | Add distance between the main legend and the ‘no data’ item in pixels |
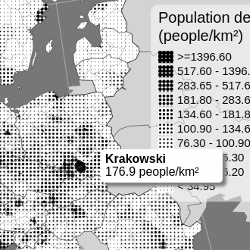
Stripe composition map
A stripe composition map is a choropleth map showing the composition of a statistical variable using a pattern of stripes of different colors and widths. The color of a stripe corresponds to its category, and its width is proportional to the share of this category in the total. A stripe composition map shows how proportions vary across space.
Here is an example of such map (see the code), and another one (see the code)
Example:
//population composition by age
eurostatmap
    .map('scomp')
    .nutsLvl(3)
    .nutsYear(2016)
    .stripeWidth(10)
    .stripeOrientation(45)
    .stat('Y_LT15', {
        eurostatDatasetCode: 'demo_r_pjanaggr3',
        filters: { age: 'Y_LT15', sex: 'T', unit: 'NR', time: '2019' },
        unitText: 'people',
    })
    .stat('Y15-64', {
        eurostatDatasetCode: 'demo_r_pjanaggr3',
        filters: { age: 'Y15-64', sex: 'T', unit: 'NR', time: '2019' },
        unitText: 'people',
    })
    .stat('Y_GE65', {
        eurostatDatasetCode: 'demo_r_pjanaggr3',
        filters: { age: 'Y_GE65', sex: 'T', unit: 'NR', time: '2019' },
        unitText: 'people',
    })
    .catLabels({ Y_LT15: '< 15', 'Y15-64': '15 to 64', Y_GE65: '> 65' })
    .catColors({ Y_LT15: '#33a02c', 'Y15-64': '#cab2d6', Y_GE65: '#ff7f00' })
    .legend({ x: 550, y: 10, title: 'Population by age' })
Or simplier:
//population composition by age
eurostatmap
    .map('scomp')
    .nutsLvl(3)
    .nutsYear(2016)
    .stripeWidth(10)
    .stripeOrientation(45)
    .statComp(
        { eurostatDatasetCode: 'demo_r_pjanaggr3', filters: { sex: 'T', unit: 'NR', time: '2019' }, unitText: 'people' },
        'age',
        ['Y_LT15', 'Y15-64', 'Y_GE65'],
        ['< 15', '15 to 64', '> 65'],
        ['#33a02c', '#cab2d6', '#ff7f00']
    )
    .legend({ x: 550, y: 10, title: 'Population by age' })
| Method | Type | Default value | Description |
|---|---|---|---|
| map.stripeWidth([value]) | number | 50 | Width of the stripes series. |
| map.stripeOrientation([value]) | number | 0 | Orientation of the stripes, in degree. Set to 0 for vertical and 90 for horizontal. |
| map.catColors([value]) | object | auto | The colors of the stripes, indexed by category code. If not specified, different colors are proposed. |
| map.catLabels([value]) | object | auto | The colors of the stripes, indexed by category code. |
| map.showOnlyWhenComplete([value]) | boolean | false | Draw a region only when data is available for all categories. If one is missing, the region is considered as with ‘no data’. If not, the value of missing data is set to 0. |
| map.noDataFillStyle([value]) | “lightgray” | The fill style to be used for regions where no data is available. | |
| map.pieChartRadius([value]) | 40 | Radius of the pie chart to show in the tooltip. | |
| map.pieChartInnerRadius([value]) | 15 | Inner radius of the pie chart to show in the tooltip. |
In addition to the default legend parameters, stripe composition maps have the following specific legend parameters:
| Method | Type | Default value | Description |
|---|---|---|---|
| map.shapeWidth([value]) | number | 13 | Width of the legend box elements. |
| map.shapeHeight([value]) | number | 15 | Height of the legend box elements. |
| map.shapePadding([value]) | number | 5 | Distance between consecutive legend box elements. |
| map.labelFontSize([value]) | int | 12 | Font size of the legend label. |
| map.labelOffset([value]) | number | 5 | Distance between the legend box elements to the corresponding text label. |
| map.noData([value]) | boolean | true | Show/hide ‘no data’ legend box element. |
| map.noDataText([value]) | string | “No data” | ‘No data’ label text. |
Sparkline map
A sparkline is a very small line chart, typically drawn without axes or coordinates. It presents the general shape of the variation (typically over time) in some measurement, such as temperature, in a simple and highly condensed way. A chart is drawn for each region showing the temporal variations of each.
Here is an example of such map (see the code)
Example:
eurostatmap
    .map('spark')
    .nutsLvl(1)
    .statSpark(
        { eurostatDatasetCode: 'demo_r_pjanaggr3', filters: { sex: 'T', unit: 'NR' }, unitText: 'people' },
        ['2009', '2010', '2011', '2012', '2013', '2014', '2015', '2016', '2017', '2018', '2019'], //dates
        ['2009', '2010', '2011', '2012', '2013', '2014', '2015', '2016', '2017', '2018', '2019'] //labels
    )
    .sparkType('area')
    .sparkLineWidth(70)
    .sparkLineHeight(20)
    .sparkLineOpacity(0.9)
    .build()
| Method | Type | Default | Description |
|---|---|---|---|
| map.sparkType([value]) | string | “area” | Type of chart to use. Can be ‘line’ or ‘area’ |
| map.sparkLineColor([value]) | string / Function | “black” | colour of the sparklines. Also accepts an acessor function e.g: .sparkLineColor((d, i) => (d[d.length - 1].value > 100 ? 'red' : 'blue')) |
| map.sparkAreaColor([value]) | string / Function | “#41afaa” | colour of the area chart fill (when sparkType set to area) Also accepts an acessor function e.g: .sparkAreaColor((d, i) => (d[d.length - 1].value > 100 ? 'red' : 'blue')) |
| map.sparkLineWidth([value]) | number | 30 | width of the spark charts |
| map.sparkLineHeight([value]) | number | 20 | height of the spark charts |
| map.sparkLineStrokeWidth([value]) | number | 0.4 | stroke width of the spark lines |
| map.sparkLineOpacity([value]) | number | 0.6 | opacity of the spark lines |
| map.sparkChartCircleRadius([value]) | number | 0.5 | Radius of the circles at each record |
| map.sparkTooltipChart([value]) | object | {width: 100, height: 80, margin: { left: 60, right: 40, top: 40, bottom: 40 }, circleRadius: 1.5} | config for the chart shown in the tooltip |
Map title & subtitle
Specify the map title, its style and position.
| Method | Type | Default value | Description |
|---|---|---|---|
| map.title([value]) | String | ”” | The title text. |
| map.titleFontSize([value]) | int | 30 | The title font size. |
| map.titleFill([value]) | String | “black” | The title text color. |
| map.titlePosition([value]) | Array ([x,y]) | auto | The title position. If not specified, a position is automatically computed, on the top left corner. |
| map.titleFontWeight([value]) | String | “bold” | The title font weight. |
| map.subtitle([value]) | String | ”” | The subtitle text. |
| map.subtitleFontSize([value]) | int | 30 | The subtitle font size. |
| map.subtitleFontWeight([value]) | String | “bold” | The subtitle text weight. |
| map.subtitleFill([value]) | String | “black” | The subtitle text color. |
| map.subtitlePosition([value]) | Array ([x,y]) | auto | The subtitle position. If not specified, a position is automatically computed, on the top left corner. |
Map font
| Method | Type | Default value | Description |
|---|---|---|---|
| map.fontFamily([value]) | String | “Helvetica, Arial, sans-serif” | The font family to use for all map components (titles, legend, labelling etc.) |
Map frame
Specify the style of the map frame (the rectangle around the map).
| Method | Type | Default value | Description |
|---|---|---|---|
| map.frameStroke([value]) | Color | “#222” | Color of the map frame |
| map.frameStrokeWidth([value]) | number | 2 | The map frame stroke width |
Map legend
Specify the style of the map legend with map.legend({parameters}).
Example:
map = eurostatmap.map(...)
	.legend({
		title: "Legend (%)",
		titleFontSize: "12",
		x: 10, y: 120,
		boxFill: "darkgray",
	});
| Parameter | Type | Default value | Description |
|---|---|---|---|
| svgId | String | auto | The SVG element where to draw the legend. If not specified, an element is automatically built within the map. |
| x | number | auto | The legend element X position, in case it is embeded within the map. If not specified, an automatic value is computed. |
| y | number | auto | The legend element Y position, in case it is embeded within the map. If not specified, an automatic value is computed. |
| boxMargin | number | 10 | The legend box margin, in pixel. |
| boxPadding | number | 7 | The legend box padding, in pixel. |
| boxCornerRad | number | 7 | The legend box corner radius, in pixel. |
| boxFill | color | “white” | The legend box fill style. |
| boxOpacity | number | 0.7 | The legend box opacity, from 0 to 1. |
| fontFill | Color | “black” | The legend font color. |
| title | Text | "” | The legend title. |
| titleFontSize | int | 15 | The legend title font size. |
| titleFontWeight | String | “normal” | The legend title font weight. |
Scalebar
| Method | Type | Default value | Description |
|---|---|---|---|
| map.showScalebar([value]) | Boolean | false | Adds a scalebar to the map |
| map.scaleBarPosition([value]) | array | calculated (bottom left) | The X/Y position of the scalebar. |
| map.scalebarFontSize([value]) | int | 8 | The font size in pixels of the scalebar text. |
| map.scalebarTicks([value]) | int | 5 | The number of ticks in the scalebar. |
| map.scalebarTickHeight([value]) | int | 13 | The height of each tick in pixels. |
| map.scalebarSegmenHeight([value]) | int | 30 | The width in pixels of each segment in the scalebar. |
| map.scalebarTextOffset([value]) | array | [4,8] | The offset in pixels for the scalebar text ([x,y]). |
| map.scalebarUnits([value]) | string | ’ km’ | The suffix text for the last scalebar label |
| map.scalebarMaxWidth([value]) | string | px | The maximum width of the scalebar |
| map.scalebarHeight([value]) | string | px | The height of the scalebar |
Tooltip
The tooltip is the little rectangle showing information on the map feature under the mouse/finger pointer.
You can configure the style and content of the tooltip.
Example:
map = eurostatmap.map(...)
	.tooltip({
		maxWidth: "200px",
		fontSize: "16px",
		background: "white",
		padding: "5px",
		border: "0px",
		borderRadius: "5px",
		boxShadow: "5px 5px 5px grey",
		transitionDuration: 200,
		xOffset: 30,
		yOffset: 20,
		textFunction: (rg => { return rg.properties.na;  }) //rg is the hovered NUTS2JSON feature
		showFlags: false
	});
| Property | Type | Default value | Description |
|---|---|---|---|
| maxWidth | String | “200px” | The maximum width of the tooltip container. |
| fontSize | String | “16px” | The font size of the tooltip text. |
| background | String | “white” | The background colour of the tooltip. |
| padding | String | “5px” | The padding of the tooltip container. |
| border | number | “0px” | The border styling of the tooltip container. |
| borderRadius | String | “5px” | The border-radius of the tooltip container. |
| boxShadow | String | “5px 5px 5px grey” | The box-shadow of the tooltip container.. |
| transitionDuration | Number | 200 | The transition time applied to the tooltip. |
| xOffset | Number | 30 | The x offset between the tooltip and the cursor. |
| yOffset | Number | 20 | The y offset between the tooltip and the cursor. |
| textFunction | Function | see example above | A function returning the text to show in a tooltip which appears when the mouse passes over map features. The function signature is function(rg, map) where rg is the selected region and map is the map. Set to null if no tooltip is needed. |
| showFlags | String | false | Set to null, 0 or false if no flag should be shown in the tooltip. Set to “short” to show the flag as a letter. Set to “long” to show the flag as a text. |
Styling
Specify specific map styles.
| Method | Type | Default value | Description |
|---|---|---|---|
| map.nutsrgFillStyle([value]) | String | “#eee” | The fill style of the NUTS regions, used for proportional symbol maps only. |
| map.nutsrgSelFillSty([value]) | String | “#purple” | The fill style of the selected NUTS regions. |
| map.nutsbnStroke([value]) | Object | {0:”#777”, 1:”#777”, 2:”#777”, 3:”#777”, oth:”#444”, co:”#1f78b4”} | The stroke style of the NUTS boundaries, depending on the NUTS level, if it is a border with another country (‘oth’) and if it is coastal (‘co’) |
| map.nutsbnStrokeWidth([value]) | Object | {0:0, 1:0.2, 2:0.2, 3:0.2, oth:1, co:1} | The stroke width of the NUTS boundaries, depending on the NUTS level, if it is a border with another country (‘oth’) and if it is coastal (‘co’). |
| map.cntrgFillStyle([value]) | Color | “#f5f5f5” | The fill style of the country areas. |
| map.cntbnStroke([value]) | Color | {0:”#777”, 1:”#777”, 2:”#777”, 3:”#777”, oth:”#444”, co:”#1f78b4”} | The stroke style of the country boundaries. |
| map.cntbnStrokeWidth([value]) | Number | {0:1, 1:0.2, 2:0.2, 3:0.2, oth:1, co:1} | The stroke width of the country boundaries. |
| map.seaFillStyle([value]) | String | “white” | The fill style of the sea areas. |
| map.drawCoastalMargin([value]) | boolean | true | Set to true to show a coastal blurry margin. False otherwise. |
| map.coastalMarginColor([value]) | String | “#c2daed” | The color of the coastal blurry margin. |
| map.coastalMarginWidth([value]) | number | 5 | The width of the coastal blurry margin. |
| map.coastalMarginStdDev([value]) | number | 2 | The standard deviation of the coastal blurry margin. |
| map.drawGraticule([value]) | boolean | false | Set to true to show the graticule (meridian and parallel lines). False otherwise. Calls to this method after the map is built will update the graticule. |
| map.graticuleStroke([value]) | String | “lightgray” | The stroke style of the graticule. |
| map.graticuleStrokeWidth([value]) | number | 1 | The stroke width of the graticule. |
Labelling
Labels for country names, country codes, and/or seas can be added to the map. Labels are displayed in the language set by the map.lg() method.
| Method | Type | Default value | Description |
|---|---|---|---|
| map.labelling([value]) | Boolean | false | Whether or not to show geographic name labels on the map. |
| map.labelsToShow([value]) | Array | [“countries”,”seas”] | The types of labels to show on the map. Accepted values are: “countries”,”seas”,”cc”,”values”. (“countries” show the full names of each country, “cc” stands for country codes and “values” show the statistical values for each NUTS region. NOTE: “values” only applies to the choropleth map type (“ch”). |
| map.labelValuesFontSize([value]) | Number | 10 | For when labelsToShow includes “values”. The font size of the labels for the statistical values. |
| map.labelFill([value]) | Object | {“seas”:”#003399”, “countries”:”#383838”, “cc”:”black”, “values”:”black”} | The colours of the labels. |
| map.labelOpacity([value]) | Object | {“seas”:1, “countries”:0.8} | The opacity of the labels. |
| map.labelShadow([value]) | Boolean | false | Whether or not to add shadows to the labels. |
| map.labelShadowsToShow([value]) | Array | [“countries”,”seas”, “cc”, “values”] | Which label types will have shadows (halos). |
| map.labelShadowWidth([value]) | Object | { “seas”: 3, “countries”: 3, “cc”: 3, “values”: 3 } | The width of the shadow added to each type of label. |
| map.labelShadowColor([value]) | Object | { “seas”: “white”, “countries”: “white”, “cc”: “white”, “values”: “white” } | The color of the shadow added to each type of label. |
| map.statLabelsPositions([value]) | Object | { “regionId”: {x:number, y:number} } | Override the positions of statistical labels. Define the x and y position of the statistical value label for each region. If the region is not found here, the label is positioned at the centroid of the region. |
| map.labelFilterFunction([value]) | Function | _(rg, map) => rg.properties.id[0] + rg.properties.id[1] == map.geo_[0] + map.geo*[1]* |
Filter the regions used for the labels. |
Insets
To add map insets, use the map.insets([values]) method.
For default map insets showing European overseas territories and small countries, use:
eurostatmap.map(...)
	.insets("default");
To specify more precisely which insets to show, their geographical extent, scale, position, etc., specify the list of insets such as:
eurostatmap.map(...)
	.insets(
		{ geo:"MT", scale:"01M", pixSize:3000, title:"Martinique", titleFontSize:16, width:200, height:90, x:0, y:0 },
		{ geo:"GF", scale:"03M", pixSize:10000, title:"French Guyana", titleFontSize:16, width:200, height:90, x:210, y:0 }
	)
	.insetBoxPosition([335,345]);
);
See also this example with a focus on Spain (see the code).
Note that a map inset is built as a proper map within a map: It has all properties of a map, and share most of them with its parent map. It is thus possible to define map insets within map insets, following a recursive structure.
| Method | Type | Default value | Description |
|---|---|---|---|
| map.insets([values]) | List | [] | The list of insets. Each map inset is described as an object with the map inset attributes. |
| map.insetBoxPosition([value]) | number | auto | The position of the insets box element within the map. |
| map.insetBoxPadding([value]) | number | 5 | When several insets are specified within the map, the distance between the different insets. |
| map.insetBoxWidth([value]) | number | 210 | The default width of the insets box, which are squared by default. |
| map.insetZoomExtent([value]) | Array | null | The zoom extent of inset maps. The first value within [0,1] defines the maximum zoom out factor - the second value within [1,infinity] defines the maximum zoom in factor. Set to [1,1] to forbid zooming and allow panning. Set to null to forbid both. |
| map.insetScale([value]) | String | “03M” | The default scale of the insets. |
Bottom text & link to source data
Specify the text to be shown at the bottom of the map.
| Method | Type | Default value | Description |
|---|---|---|---|
| map.bottomText([value]) | String | Some default text | The text. Note that the default value is mandatory. |
| map.botTxtFontSize([value]) | int | 12 | The font size. |
| map.botTxtFill([value]) | String | “black” | The text color. |
| map.botTxtPadding([value]) | number | 10 | The padding, in pixel. |
| map .botTxtTooltipTxt([value]) | String | The default disclaimer message. | Set a text to be shown in a tooltip when passing over the bottom text. Set to null if no tooltip has to be shown. |
| map .showSourceLink([value]) | Boolean | true | Shows a link to the source dataset in the bottom right corner. (uses eurostatdatabasecode specified when using the stat() function). |
Export
Export the map as a PNG image or a SVG file.
| Method | Type | Default value | Description |
|---|---|---|---|
| map.exportMapToPNG() | this | Export the map as a PNG image. | |
| map.exportMapToSVG() | this | Export the map as a SVG image. |
Miscellaneous
| Method | Type | Default value | Description |
|---|---|---|---|
| map.noDataText([value]) | String | “No data available” | The text to show for regions where no data is available. |
| map.lg([value]) | String | “en” | The language code, for multilingual maps. |
| map.transitionDuration([value]) | int | 800 | When updating statistical figures, the map style changes progressively. This parameter sets the duration of this transition, in ms. |
| map.filtersDefinitionFun([value]) | Function | function() {} | A function defining SVG filter elements. To be used to defined fill patterns. |
| map.callback([value]) | Function | undefined | A function to execute after the map build is complete. |
| map.getTime() | String | - | Return the time parameter of the statistical data. When a filter such as { lastTimePeriod : 1 } is used, this method allows a retrieval of the map timestamp. |
| map.setFromURL() | this | - | Set some map parameters based on URL parameters: “w” for width, “h” for height, “x” for xGeoCenter, “y” for yGeoCenter, “z” for pixGeoSize, “s” for scale, “lvl” for nuts level, “time” for time, “proj” for the CRS, “geo” for the geographical territory, “ny” for the NUTS version, “lg” for the langage, “sl” to show legend, “clnb” for the number of classes. |
Build and update
After changing some parameters, one of the following methods need to be executed:
| Method | Type | Default value | Description |
|---|---|---|---|
| map.build() | this | Build (or rebuild) the entire map. | |
| map.updateGeoData() | this | Get new geometrical data. It should be used to update the map when parameters on the map geometries have changed. | |
| map.buildMapTemplate() | this | Update the map when parameters on the map template have changed. | |
| map.updateStatData() | this | Get new statistical data. It should be used to update the map when parameters on the statistical data sources have changed. | |
| map.updateStatValues() | this | Update client side information related to statistical values. It should be used to update the map when statistical values have changed. | |
| map.updateClassification() | this | Update the map when parameters on the classification have changed. | |
| map.updateStyle() | this | Update the map when parameters on the styling have changed. |
Anything unclear or missing? Feel free to ask !