Example 3 - d3-tree-based visualisation of database contents as a collapsible tree
Description
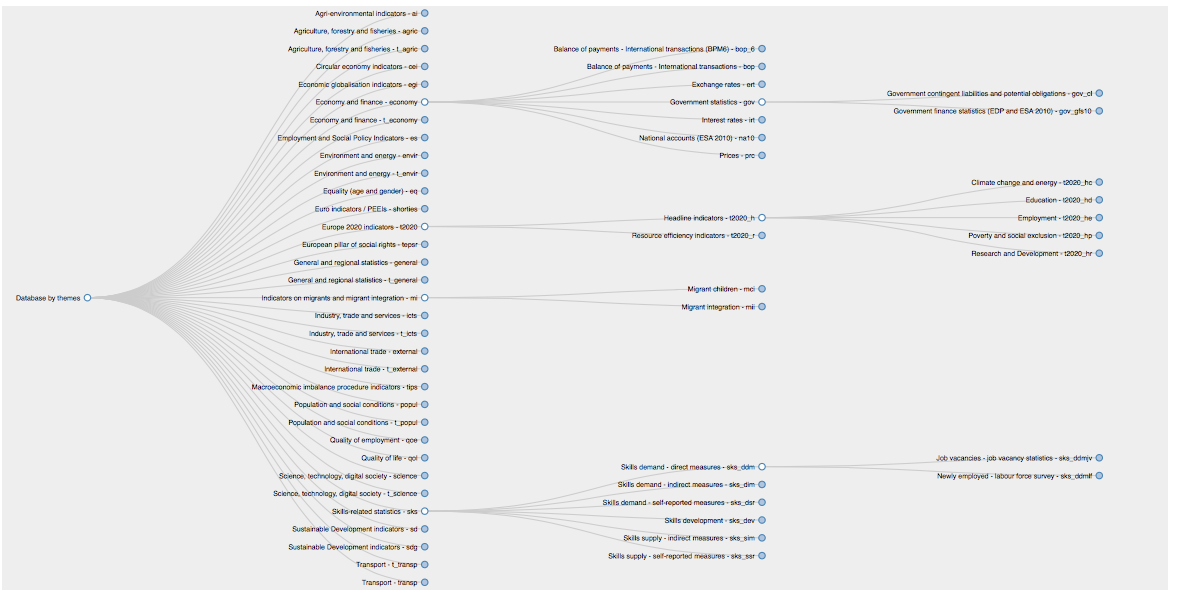
The implementation presented here reuses the d3-tree material introduced in an example of graph visualisation as tree, and aims at representing the table of contents of Eurostat online database.
The webpage example3_toc.html represents the table of contents of Eurostat online database as a collapsible tree implementing Reingold-Tilford algorithm. See below for further useful references.
 |
You can get a preview of this page (e.g., using githack): check this address for direct rendering.
Usage
The original material includes: the Javascript source code dndTree.js that has been slightly adapted for the purpose of this visualisation.
The Python code example3_ToC.py will enable you to reproduce the tables (files) used in the visualisation of the table of contents.
We also provide two generic modules that will enable you to select and prepare the metadata like in the visualisation example:
metadata.pycontains the classes/methods that help retrieve, from Eurostat website, the metadata in bulk format;create_tree.pycontains the method that formats the table of contents and exports it so as to be used in the visualisation.
The latter module will generate a single JSON file (actually a Javascript script), ToC.json that contains the formatted table of contents.
References
- What is a tree diagram?.
- M.Bostock’s original tidy and collapsible trees.
- R.Schmuecker
d3-based example of “drag-and-drop zoomable, panning, collapsible tree with auto-sizing”. Sources available here. - J.Zieve’s searchable collapsible tree.
d3-treelayout package.- collapsibleTree implementation of collapsible tree in
R. - Eurostat table of contents on bulk download facility.