Example 2 - d3-based chord diagram visualisation of metadata
Description
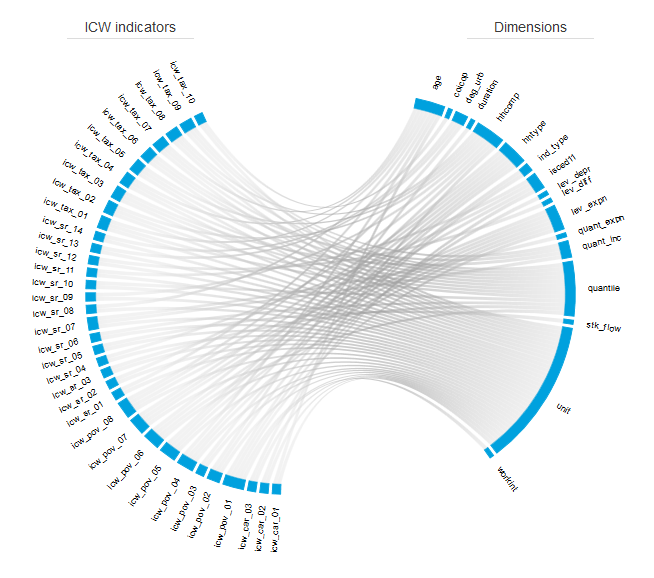
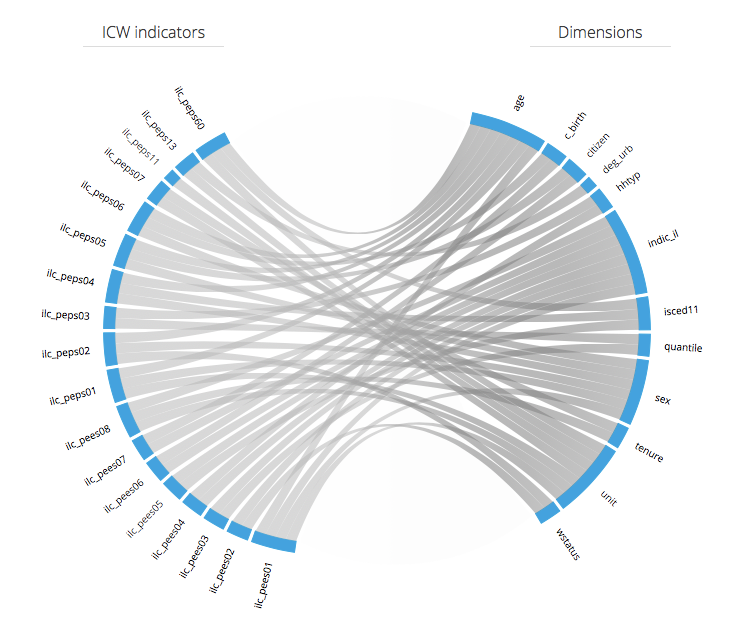
The chord implementation presented here reuses the d3 material introduced in an online tutorial on flow diagrams, and aims at representing the dependency links (relationship: “which indicator utilise(s) this dimension? which dimension(s) are concerned by this indicator?) between some Eurostat indicators and the dimensions that are exploited for the definition of the population breakdowns.
The webpage example2_icw.html shows the dependency between the various Eurostat (experimental) indicators on income, consumption and wealth (ICW) and the different concerned dimensions. See below for further useful references.
| ICW indicators | PEPS/PEES indicators |
 |
 |
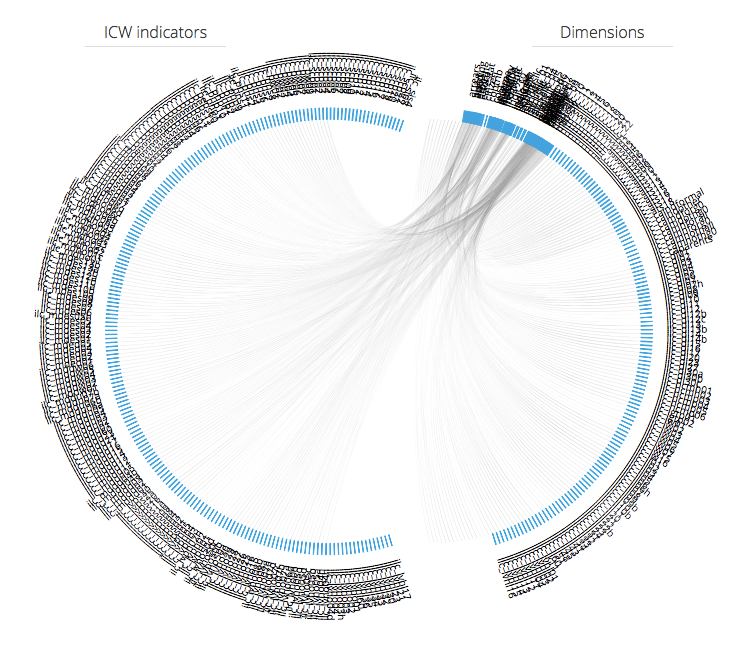
(far too many) ILC indicators |
 |
You can get a preview of this page (e.g., using githack): check this address for direct rendering. Another example displaying metadata for EU-SILC indicators is also presented.
Usage
The original material includes: the index.html webpage as well as the Javascript source codes d3.layout.chord.sort.js and
d3.layout.chord.sort.js. The source script.js has been slightly adapted so as to make the dynamic data loading of (dimension/indicator) data within the index.html page possible. It has also been split in two so as to provide a separate configuration of the title of the graph in title.js.
The Python code example2_icw.py will enable you to reproduce the tables (files) used in the visualisation of the data/metadata relationship. It can be easily adapted to produce similar tables for other indicators.
We also provide two generic modules that will enable you to select and prepare the metadata like in the visualisation example:
metadata.pycontains the classes/methods that help retrieve, from Eurostat website, the metadata in bulk format; it also contains the method that will enable you to select the output indicators (see the role of the variableINDICATOR_KEEPin the codeexample2_icw.py) as well as the dimensions (ibid, see the use of the variableDIMENSION_DROP) to be presented;build_chord.pycontains the method that formats and exports the input metadata table to be used in the visualisation.
The latter module will generate 3 JSON files (which are actually also Javascript scripts…), namely:
INDICATOR.jsoncontains the list of indicators selected and whose metadata have been collected for,DIMENSION.jsoncontains the list of dimensions used by any of the indicators in the list above,INDICATORxDIMENSION.jsoncontains the pseudo adjacency matrix used to represent the relationships between indicators and dimensions.
These files can then be dynamically loaded by the generic index.html webpage. Note that any number of input indicator(s) present in the original metabase.txt file can be selected, though it is recommended to keep this number small (see figure above with all EU-SILC indicators selected for representation).
For the visualisation of the metadata related to ICW indicators, the webpage example2_icw.html has been created as a specific copy of the generic index.html webpage. To display the chord diagram locally in your browser, it will be necessary to download:
- the source webpage _example2_icw.html,
- the
Javascriptscriptsd3.layout.chord.sort.js,d3.layout.chord.sort.js,title.jsandscript.js, - the generated
JSONfiles.
References
- N. Bremer’s
d3-based tutorial on “How to create a flow diagram with a circular Twist”. d3-chord.- Eurostat metabase file on bulk download facility.
- Eurostat Experimental Statistics webpage on Income, Consumption and Wealth.
- R source codes for Experimental Statistics on (household) Income, Consumption and Wealth.