Example 1 - d3-force based visualisation of indicators
Description
This page provides relevant tools used to prepare selected social indicator data downloaded from ESTAT website and provide an interactive display based on d3-force layout. These tools aim at reusing the material developed by S.Carter for the New York Times publication mentioned below so as to provide with a similar visualisation.
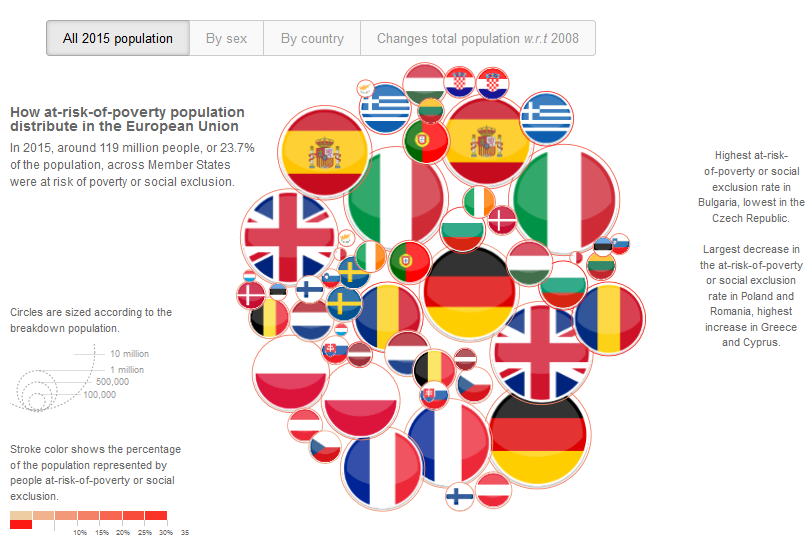
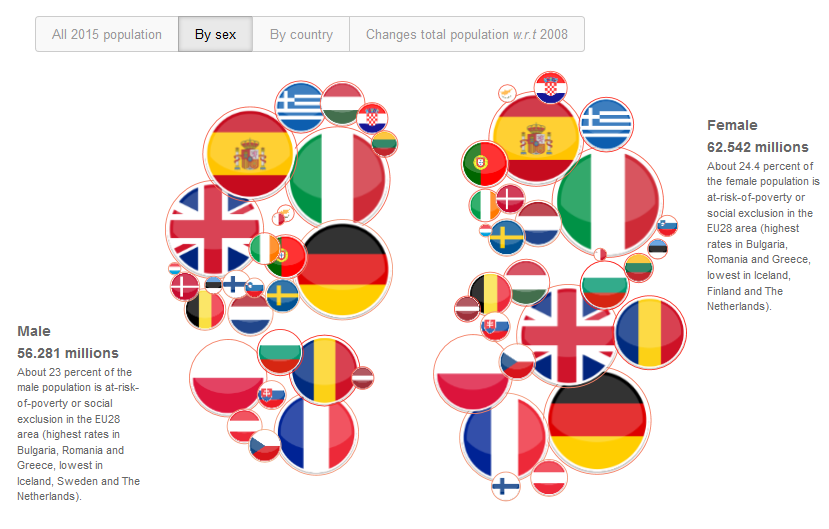
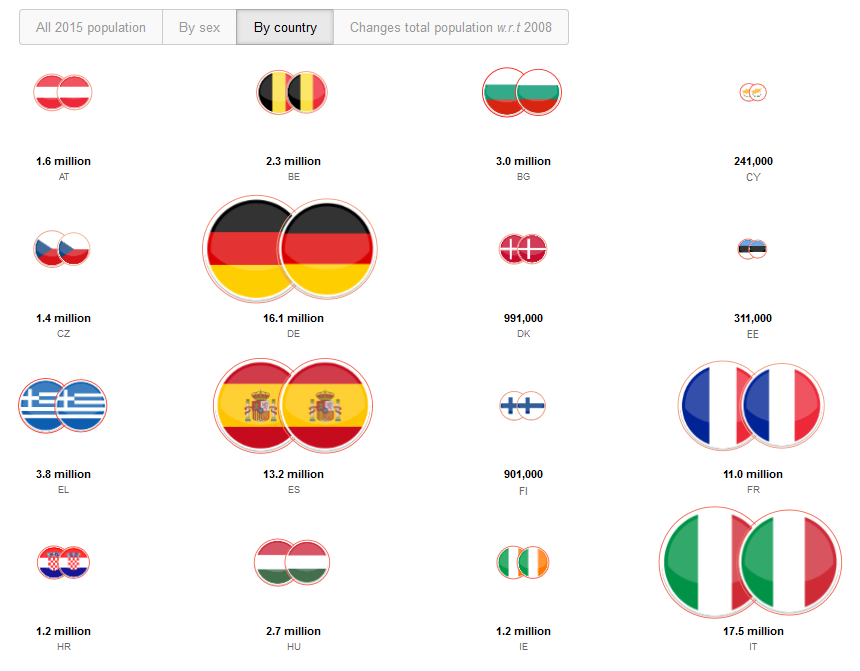
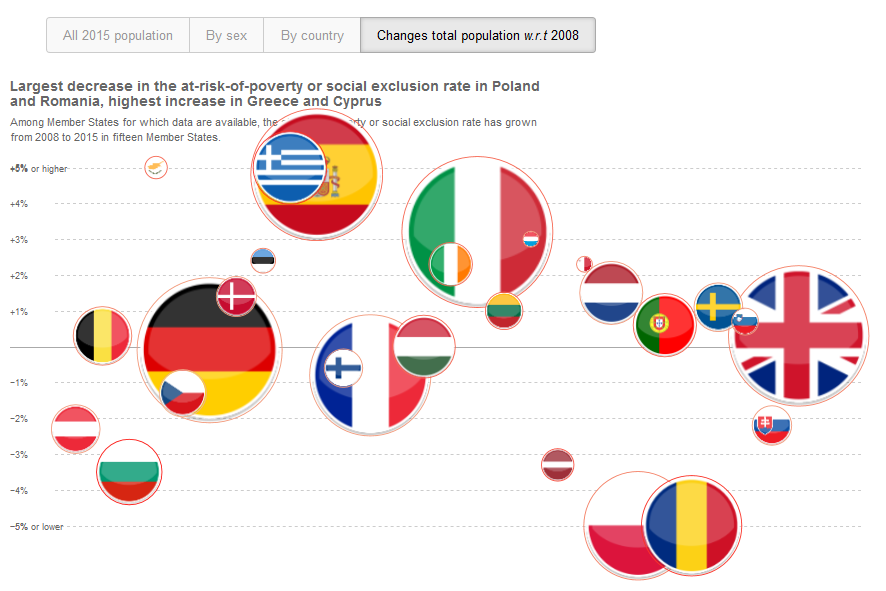
The webpage example1_peps01.html illustrates some important figures related to ESTAT indicator ilc_peps01 on people at risk of poverty or social exclusion by age and sex (see also the news release below). The different pages are shown below:
 |
 |
 |
 |
To actually see the interactive visualisation, you need to download the webpage and display it locally in your browser. You can get a preview of this page (e.g., using githack: check this address for direct rendering, though the display is much slower and some of its features are disabled.
Usage
All html/javascript/css resources used by the original “Four ways to slice…“ publication have been embedded in the webpage example1_peps01.html. The code has been modified accordingly so as to visualise specifically the selected data (see javascript variables estat.rate_data_total, estat.category_list and estat.category_data).
We provide hereby two Python modules that will enable you to prepare the selected social indicators data for the visualisation:
data.pycontains the classes/methods that will help you download the data from ESTAT website;display_force.pycontains the classes/methods that will enable you to format the data to be inserted in the webpage.
Note in particular that display_force.py implements some circle packing algorithms for optimally filling a circle with other circles: this is used to position the circle centers in the initial overall display.
Data requested for the visualisation proposed in example1_peps01.html webpage are formatted in the example1_peps01.py script. They are output as JSON but can be copied ‘as is’ in the webpage source code.
References
- S. Carter’s
d3-force-based display: “Four ways to slice Obama’s 2013 budget proposal”, New York Times. d3-forcelayout package.- Eurostat press release 199/2016: “The share of persons at risk of poverty or social exclusion in the EU back to its pre-crisis level”.
- Eurostat Statistical Explained webpage on People at risk of poverty or social exclusion.
- Eurostat bubble chart: “My country in a bubble”.
- Algorithm for circle packing, Wolfram.