 |
PING
0.9
Statistical data handling and processing in production environment
|
|
PING
0.9
Statistical data handling and processing in production environment
|
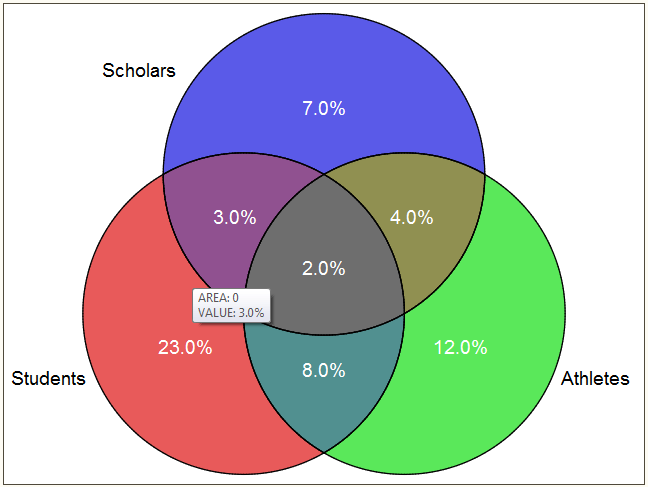
Plot 3-way Venn diagrams (using PROC GMAP) with values displayed in each set and/or set intersections.
idsn : name of the input dataset containing 3 set indicator variables along with a 4th variable (either a cell count, an id variable or a variable direclty containing the information to be displayed in each set or set intersections); see example below;var : (option) lists of set indicator variables, 3 in total; each of these variables is binary, taking value 1 for values in corresponding set, 0 for values outside of the corresponding set; when not passed, the 3 first variables of idsn dataset are retrieved (i.e., by varnum order) assuming they are correctly formatted;valpct : (option) if idsn consists of 3 set indicator variables and a variable (which could be a text variable) to be displayed on the plot, specify the corresponding variable name throught the valpct argument; this option is incompatible with options valnum and valid below;valnum : (option) if idsn already consists of cell counts to be displayed on the plot, then the variable where these cell counts can be found must be specified through the valnum argument; this option is incompatible with options valpct above and valid below;valid : (option) if idsn consists of a series of observations (patients) with an ID variable and 3 set indicator variables, then the ID variable should be specified through the valid argument; this option is incompatible with options valpct and valnum above;format : (option) SAS format in which values printed in each set should be displayed; default is percent8.1 when valpct is set, 8.1 otherwise;ofn : (option) name of the .html output file to be saved; an image will also be saved with the same name, with file extension as defined by imgFmt (see below); by default, no file is saved;odir : (option) path of the directory where output .html file and image (with generic name ofn) shall be saved; obviously ignored when ofn is not passed;title : (option) title to be displayed on top of the plot; default is "Venn Diagram - <idsn>", where <idsn> stands for the name of the input dataset idsn;label : (option) labels (3 in total) to be printed next to each set; default is to use each set indicator variable names available through var;hover : (option) formatted list of quoted items which contain text to be displayed when hovering over each set or set intersections with the mouse; the order of display in hover is given by the sequence: 1 2 3 12 23 13 123 where the number indicates the order of the variables in var which is concerned by the set or set intersection; in particular, hover must be of length 7 (number of sets in the Venn diagram); by default, hover is the concatenation of the corresponding set label(s);fontSize : (option) font size for values to be displayed in each set or set intersections; default: 4;labelFontSize : (option) font size for set labels; default: 4;imgFmt : (option)image format; default: imgFmt=gif; an alternative is png;valColor : (option)color of values displayed in sets; default: valColor=white.bgColor : (option)background color; default: bgColor=white;ilib : (option) name of the input library; by default: empty, i.e. WORK is used.We provide here an example presented in the original code (see note below).
Given the table Example in WORKing library:
then running:
%diagram_venn(Example, var=Scholars Students Athletes, valpct=p, format=percent8.1);
will produce the following graphical result:
Run macro %_example_diagram_venn for examples.
%diagram_venn is a wrapper to L. Joseph's original %VennDiagram macro which implements a 3-Way non-proportional Venn diagram. Original source code (no license, no disclaimer) is available at http://www.medicine.mcgill.ca/epidemiology/joseph/pbelisle/VennDiagram.html.PROC GMAP where each segment of the Venn diagram is a totally separate map area, so the color/drilldown/etc of each piece can be controlled separately. 1.8.13